Paygrade study · United States · 3,144 counties · BLS May 2025 pay · HUD FY2027 rents · 2026 tax
Can teachers, nurses and police afford rent where they work?
A median-paid elementary school teacher would spend more than 30% of take-home pay on a one-bedroom at HUD's Fair Market Rent in 451 of the 3,129 US counties with a published teacher median. For a full-time worker on the state minimum wage it is every one of the 3,144 counties. We set the median pay of eleven jobs that keep a town running, and of a minimum wage worker, against the official rent in every county of the 50 states and DC, before and after tax. Find yours below.

By Dominic Roworth · Published 21 November 2026 · Find your county · Download the data (CSV)
Elementary teachers
451
counties where a one-bedroom takes over 30% of the median teacher's take-home pay (109 before tax)
Police officers
369
counties over 30% of take-home for a one-bedroom (109 before tax)
Nursing assistants
2,331
counties over 30% of take-home; for registered nurses, 66
Minimum wage worker
24.4 hours
of work a week for a one-bedroom's rent in the middle county, full time on the state minimum wage
What the data shows
- Teachers. A median-paid elementary school teacher would spend more than 30% of gross pay on a one-bedroom at HUD's Fair Market Rent in 109 of the 3,129 counties with a published teacher median (3.5%). After federal and state tax it is 451 counties (14.4%). For a two-bedroom: 371 counties on gross pay, 1,045 on take-home. Secondary teachers: 102 counties, 400 after tax.
- Police, firefighters and EMTs. Police officers: 109 of 3,134 counties over 30% of gross pay for a one-bedroom (3.5%), 369 after tax. Firefighters: 577 of 2,987 (19.3%), 1,419 after tax. EMTs: 1,052 of 3,005 (35.0%), 2,095 after tax.
- Nurses and nursing assistants are far apart. A median-paid registered nurse is over 30% of gross pay for a one-bedroom in 1 of 3,126 counties (Nantucket County, MA) and 66 after tax; a nursing assistant in 1,155 of 3,138 (36.8%) and 2,331 after tax.
- The lowest-paid jobs are over the line almost everywhere: childcare workers in 2,916 of 3,123 counties (93.4%), cashiers in 3,013 of 3,144 (95.8%) and restaurant cooks in 2,117 of 3,141 (67.4%), all on BLS's full-time yearly figure. Truck drivers: 327 of 3,144 (10.4%).
- The minimum wage. A full-time worker on the state minimum wage on 1 January 2027 would be over 30% of gross pay for a one-bedroom in 2,952 of 3,144 counties (93.9%) and over 30% of take-home in all of them. In the middle county the rent alone takes 24.4 hours of work a week; the most is Summit County, UT: 60.4 hours a week at $7.25 an hour, 151.1% of a full-time year's gross pay.
- Where it is hardest. The least affordable county for a median-paid elementary teacher is Miami-Dade County, FL: a $2,121 one-bedroom is 43.7% of $58,300 gross pay and 51.9% of take-home. For a police officer it is Nantucket County, MA: $2,739 against $74,840, 43.9% of gross and 57.0% of take-home.
- Where pay goes furthest. A firefighter's pay goes furthest in Lynn County, TX, where a $784 one-bedroom is 12.2% of the $77,290 median.
- How many people live there. 58,436,255 people (HUD's 2024 county populations) live in counties where a median-paid elementary teacher would be over 30% of gross pay for a one-bedroom; for police officers it is 43,361,314, for firefighters 101,187,094.
"Over 30%" is HUD's own rent burden line: a year of the Fair Market Rent for a one-bedroom (or two-bedroom) home, divided by the median pay of the job in the county's BLS pay area. The shares are Paygrade calculations from BLS and HUD figures. How we did it and what it can't tell you.
Every job at a glance
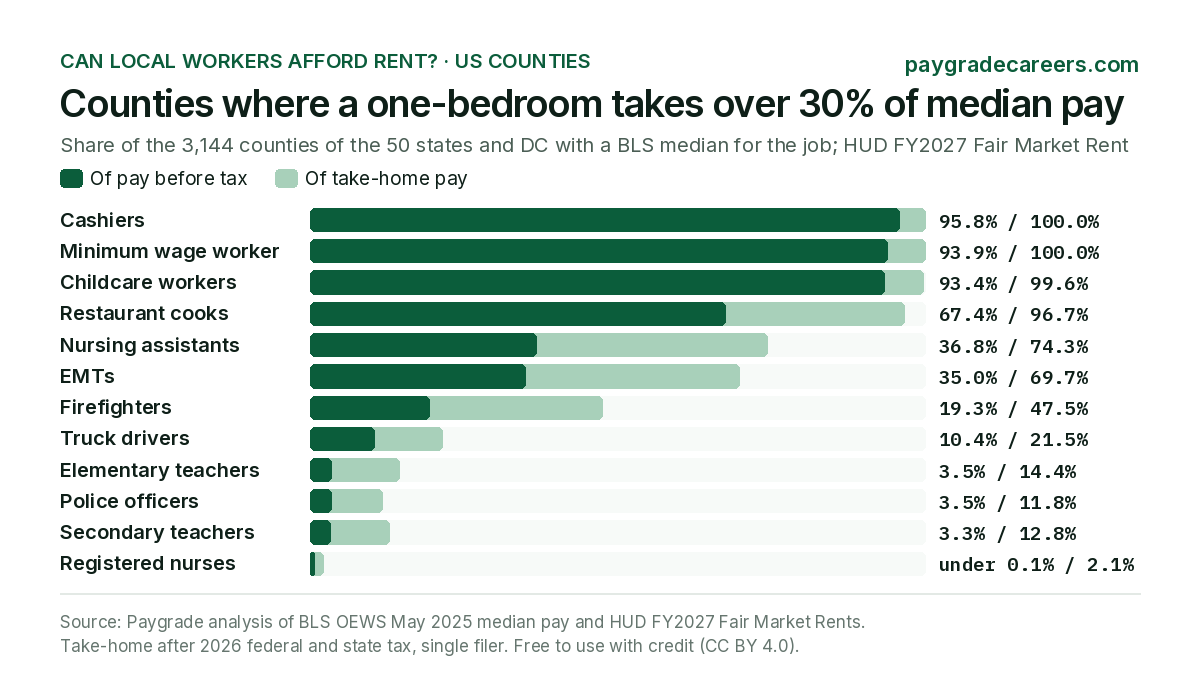
The share of US counties where a one-bedroom at HUD's Fair Market Rent takes more than 30% of the job's median pay, counting the counties where BLS publishes a median for the job.
Counties where a one-bedroom takes over 30% of median pay
Share of the counties with a published BLS median for each job.
- Cashiers 3,013 of 3,144 counties 95.8%
- Minimum wage worker 2,952 of 3,144 counties 93.9%
- Childcare workers 2,916 of 3,123 counties 93.4%
- Restaurant cooks 2,117 of 3,141 counties 67.4%
- Nursing assistants 1,155 of 3,138 counties 36.8%
- EMTs 1,052 of 3,005 counties 35.0%
- Firefighters 577 of 2,987 counties 19.3%
- Truck drivers 327 of 3,144 counties 10.4%
- Elementary teachers 109 of 3,129 counties 3.5%
- Police officers 109 of 3,134 counties 3.5%
- Secondary teachers 102 of 3,118 counties 3.3%
- Registered nurses 1 of 3,126 counties under 0.1%
- Cashiers 3,144 of 3,144 counties 100.0%
- Minimum wage worker 3,144 of 3,144 counties 100.0%
- Childcare workers 3,112 of 3,123 counties 99.6%
- Restaurant cooks 3,036 of 3,141 counties 96.7%
- Nursing assistants 2,331 of 3,138 counties 74.3%
- EMTs 2,095 of 3,005 counties 69.7%
- Firefighters 1,419 of 2,987 counties 47.5%
- Truck drivers 675 of 3,144 counties 21.5%
- Elementary teachers 451 of 3,129 counties 14.4%
- Secondary teachers 400 of 3,118 counties 12.8%
- Police officers 369 of 3,134 counties 11.8%
- Registered nurses 66 of 3,126 counties 2.1%
| Job | Counties with a median | One-bedroom, counties over 30% | Two-bedroom, counties over 30% | Middle county, one-bedroom | People in counties over 30% (1BR, of pay) | |||||
|---|---|---|---|---|---|---|---|---|---|---|
| Of pay | Share | Of take-home | Of pay | Of take-home | % of pay | % of take-home | Hours a week | |||
| Elementary school teachers | 3,129 | 109 | 3.5% | 451 | 371 | 1,045 | 18.2% | 22.3% | n/a | 58,436,255 |
| Secondary school teachers | 3,118 | 102 | 3.3% | 400 | 300 | 900 | 17.5% | 21.6% | n/a | 56,464,037 |
| Police and sheriff's patrol officers | 3,134 | 109 | 3.5% | 369 | 308 | 1,129 | 18.2% | 22.6% | 7.3 | 43,361,314 |
| Firefighters | 2,987 | 577 | 19.3% | 1,419 | 1,559 | 2,404 | 24.3% | 29.6% | 9.7 | 101,187,094 |
| Emergency medical technicians | 3,005 | 1,052 | 35.0% | 2,095 | 2,362 | 2,982 | 27.4% | 32.6% | 10.9 | 257,761,734 |
| Registered nurses | 3,126 | 1 | under 0.1% | 66 | 18 | 202 | 12.7% | 16.3% | 5.1 | 14,483 |
| Nursing assistants | 3,138 | 1,155 | 36.8% | 2,331 | 2,666 | 3,138 | 27.8% | 33.1% | 11.1 | 270,870,486 |
| Childcare workers | 3,123 | 2,916 | 93.4% | 3,112 | 3,123 | 3,123 | 37.3% | 43.5% | 14.9 | 328,708,763 |
| Cashiers | 3,144 | 3,013 | 95.8% | 3,144 | 3,144 | 3,144 | 36.7% | 42.6% | 14.7 | 331,706,453 |
| Restaurant cooks | 3,141 | 2,117 | 67.4% | 3,036 | 3,135 | 3,141 | 32.4% | 38.1% | 13.0 | 308,213,122 |
| Heavy and tractor-trailer truck drivers | 3,144 | 327 | 10.4% | 675 | 642 | 1,523 | 19.8% | 24.3% | 7.9 | 151,390,867 |
| Minimum wage worker (full time, state rate on 1 Jan 2027) | 3,144 | 2,952 | 93.9% | 3,144 | 3,144 | 3,144 | 61.0% | 66.8% | 24.4 | 331,362,263 |
"Middle county" is the median of the counties with a published figure, not weighted by population. 3,144 counties and 334,921,572 people (HUD's 2024 populations) in all. Hours: hours of work a week at the job's median hourly wage; BLS publishes teachers' pay as a yearly salary only. The minimum wage worker is full time (2,080 hours a year) on the state rate on 1 January 2027.
Find your county
Pick a state and a county to see what a one-bedroom and a two-bedroom at HUD's Fair Market Rent take from the median pay of each job there, before and after tax, and how many hours of work a week it takes. The link in your address bar (such as #county=12086 for Miami-Dade County) opens the same view.
Miami-Dade County, Florida
- One-bedroom rent
- $2,121
- Two-bedroom rent
- $2,564
- People (2024)
- 2,738,356
Rents: HUD's FY2027 Fair Market Rents, a month, for the Miami-Miami Beach-Kendall, FL HUD Metro FMR Area. Pay: BLS's May 2025 medians for the Miami-Fort Lauderdale-West Palm Beach, FL metro area, which every county in it shares.
Rent as a share of median pay, Miami-Dade County, FL
HUD's FY2027 Fair Market Rent, a year, against the median pay of each job. Over 30% is HUD's rent burden line.
- Over 30%
- 30% or less
- Cashiers 84.1%
- Minimum wage worker 81.6%
- Childcare workers 73.2%
- Restaurant cooks 68.9%
- Nursing assistants 67.0%
- EMTs 63.5%
- Truck drivers 49.3%
- Elementary teachers 43.7%
- Secondary teachers 42.1%
- Firefighters 33.6%
- Police officers 31.9%
- Registered nurses 27.9%
- Cashiers 96.1%
- Minimum wage worker 93.4%
- Childcare workers 84.5%
- Restaurant cooks 79.9%
- Nursing assistants 77.8%
- EMTs 74.0%
- Truck drivers 58.3%
- Elementary teachers 51.9%
- Secondary teachers 50.2%
- Firefighters 41.0%
- Police officers 39.2%
- Registered nurses 34.8%
- Cashiers 101.7%
- Minimum wage worker 98.6%
- Childcare workers 88.5%
- Restaurant cooks 83.3%
- Nursing assistants 81.0%
- EMTs 76.7%
- Truck drivers 59.6%
- Elementary teachers 52.8%
- Secondary teachers 50.9%
- Firefighters 40.6%
- Police officers 38.5%
- Registered nurses 33.7%
- Cashiers 116.2%
- Minimum wage worker 112.9%
- Childcare workers 102.2%
- Restaurant cooks 96.6%
- Nursing assistants 94.0%
- EMTs 89.4%
- Truck drivers 70.5%
- Elementary teachers 62.8%
- Secondary teachers 60.7%
- Firefighters 49.5%
- Police officers 47.3%
- Registered nurses 42.1%
| Job | Median pay | Take-home | One-bedroom, % of | Two-bedroom, % of | Hours a week | |||
|---|---|---|---|---|---|---|---|---|
| pay | take-home | pay | take-home | 1BR | 2BR | |||
| Elementary teachers | $58,300 | $49,024 | 43.7% | 51.9% | 52.8% | 62.8% | n/a | n/a |
| Secondary teachers | $60,410 | $50,719 | 42.1% | 50.2% | 50.9% | 60.7% | n/a | n/a |
| Police officers | $79,840 | $64,997 | 31.9% | 39.2% | 38.5% | 47.3% | 12.8 | 15.4 |
| Firefighters | $75,710 | $62,092 | 33.6% | 41.0% | 40.6% | 49.5% | 13.4 | 16.3 |
| EMTs | $40,100 | $34,400 | 63.5% | 74.0% | 76.7% | 89.4% | 25.4 | 30.7 |
| Registered nurses | $91,380 | $73,116 | 27.9% | 34.8% | 33.7% | 42.1% | 11.1 | 13.5 |
| Nursing assistants | $38,010 | $32,721 | 67.0% | 77.8% | 81.0% | 94.0% | 26.8 | 32.4 |
| Childcare workers | $34,750 | $30,102 | 73.2% | 84.5% | 88.5% | 102.2% | 29.3 | 35.4 |
| Cashiers | $30,250 | $26,486 | 84.1% | 96.1% | 101.7% | 116.2% | 33.7 | 40.7 |
| Restaurant cooks | $36,920 | $31,845 | 68.9% | 79.9% | 83.3% | 96.6% | 27.6 | 33.3 |
| Truck drivers | $51,580 | $43,625 | 49.3% | 58.3% | 59.6% | 70.5% | 19.7 | 23.9 |
| Minimum wage worker $15.00 an hour, full time | $31,200 | $27,249 | 81.6% | 93.4% | 98.6% | 112.9% | 32.6 | 39.4 |
Shares over 30%, HUD's rent burden line, are in bold. Take-home: after federal and state income tax, Social Security, Medicare and state payroll levies, for a single filer (2026 rules). Hours: hours of work a week at the median hourly wage to pay the rent; BLS publishes teachers' pay as a yearly salary only.
Minimum wage: state rate; local minimum wages left out.
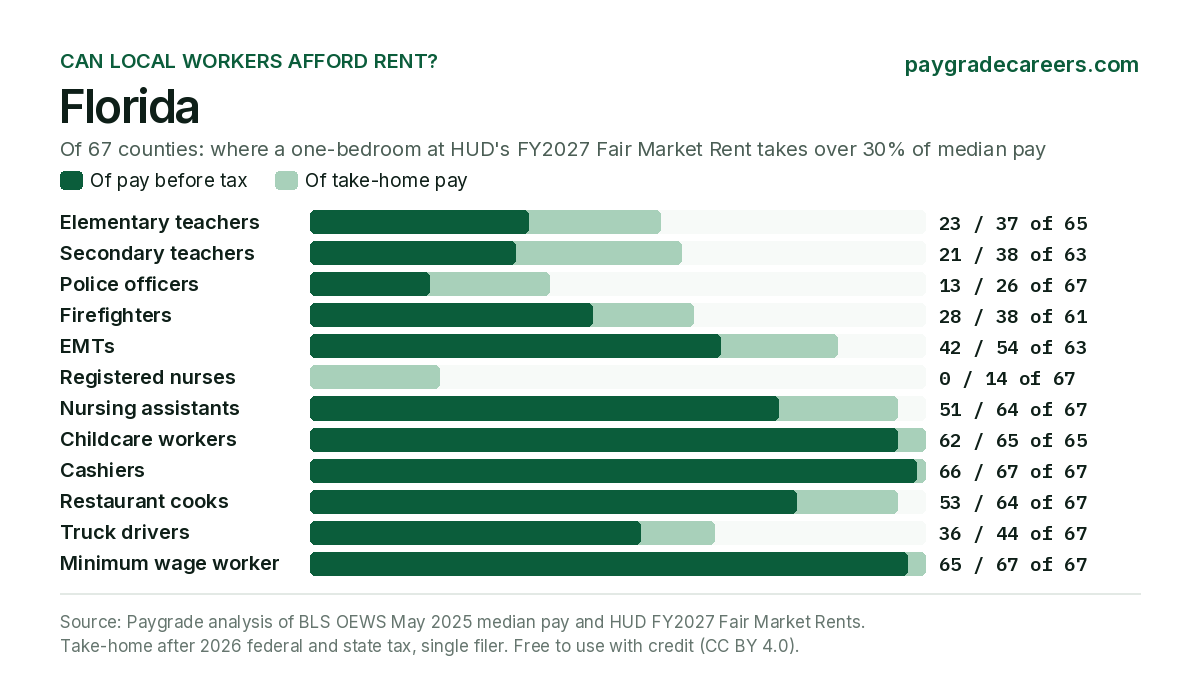
Across Florida
For each job, how many of the state's counties are over the line, the middle county, and the least and most affordable county (one-bedroom rent as a share of median pay).
| Job | Counties over 30% | Middle county, 1BR % of pay | Least affordable, 1BR % of pay | Most affordable | ||
|---|---|---|---|---|---|---|
| 1BR, of pay | 1BR, of take-home | 2BR, of pay | ||||
| Elementary teachers | 23 of 65 | 37 of 65 | 37 of 65 | 27.6% | Miami-Dade County 43.7% | Jackson County 13.9% |
| Secondary teachers | 21 of 63 | 38 of 63 | 34 of 63 | 26.9% | Miami-Dade County 42.1% | Levy County 16.8% |
| Police officers | 13 of 67 | 26 of 67 | 26 of 67 | 22.6% | Monroe County 41.8% | Baker County 14.2% |
| Firefighters | 28 of 61 | 38 of 61 | 41 of 61 | 28.9% | Monroe County 52.1% | Baker County 19.0% |
| EMTs | 42 of 63 | 54 of 63 | 52 of 63 | 37.9% | Miami-Dade County 63.5% | Okeechobee County 19.1% |
| Registered nurses | 0 of 67 | 14 of 67 | 8 of 67 | 19.1% | Monroe County 29.9% | Jackson County 10.8% |
| Nursing assistants | 51 of 67 | 64 of 67 | 67 of 67 | 44.0% | Miami-Dade County 67.0% | Jackson County 23.5% |
| Childcare workers | 62 of 65 | 65 of 65 | 65 of 65 | 47.7% | Miami-Dade County 73.2% | Jackson County 27.1% |
| Cashiers | 66 of 67 | 67 of 67 | 67 of 67 | 52.0% | Miami-Dade County 84.1% | Jackson County 29.9% |
| Restaurant cooks | 53 of 67 | 64 of 67 | 67 of 67 | 43.8% | Miami-Dade County 68.9% | Levy County 27.6% |
| Truck drivers | 36 of 67 | 44 of 67 | 45 of 67 | 30.6% | Miami-Dade County 49.3% | Jackson County 17.5% |
| Minimum wage worker | 65 of 67 | 67 of 67 | 67 of 67 | 48.6% | Miami-Dade County 81.6% | Jackson County 28.2% |
"Of" counts the counties with a published BLS median for the job. Least and most affordable use reliable BLS figures only; "and 2 more" means other counties share that exact share.
Most and least affordable counties
Ranked by a one-bedroom's rent as a share of the job's median pay, in the state above and in the whole US. Only reliable BLS figures are ranked (at least 100 jobs in the pay area and a wage error of 10% or less): the others stay in the finder and the CSV.
Elementary teachers in Florida
Least affordable (65 ranked counties)
| # | County | Median pay | 1BR rent | 1BR, % of pay | 1BR, % of take-home | 2BR, % of pay |
|---|---|---|---|---|---|---|
| 1 | Miami-Dade CountyMiami-Fort Lauderdale-West Palm Beach, FL | $58,300 | $2,121 | 43.7% | 51.9% | 52.8% |
| 2 | Monroe CountySouth Florida nonmetropolitan area | $56,590 | $1,990 | 42.2% | 50.1% | 47.8% |
| 3 | Palm Beach CountyMiami-Fort Lauderdale-West Palm Beach, FL | $58,300 | $2,008 | 41.3% | 49.1% | 48.4% |
| 4 | Broward CountyMiami-Fort Lauderdale-West Palm Beach, FL | $58,300 | $1,902 | 39.1% | 46.6% | 47.8% |
| 5 | Martin CountyPort St. Lucie, FL | $53,610 | $1,718 | 38.5% | 45.5% | 46.3% |
1 more county is tied with number 5 at 38.5%.
Most affordable
| # | County | Median pay | 1BR rent | 1BR, % of pay | 1BR, % of take-home | 2BR, % of pay |
|---|---|---|---|---|---|---|
| 1 | Jackson CountyNorth Florida nonmetropolitan area | $63,050 | $733 | 13.9% | 16.6% | 18.3% |
| 2 | Union CountyNorth Florida nonmetropolitan area | $63,050 | $777 | 14.8% | 17.6% | 19.4% |
| 3 | Putnam CountyNorth Florida nonmetropolitan area | $63,050 | $792 | 15.1% | 18.0% | 19.8% |
| 4 | Dixie CountyNorth Florida nonmetropolitan area | $63,050 | $872 | 16.6% | 19.8% | 19.8% |
| 5 | Hamilton CountyNorth Florida nonmetropolitan area | $63,050 | $872 | 16.6% | 19.8% | 18.1% |
1 more county is tied with number 5 at 16.6%.
Elementary teachers in the US
Least affordable (3,097 ranked counties)
| # | County | Median pay | 1BR rent | 1BR, % of pay | 1BR, % of take-home | 2BR, % of pay |
|---|---|---|---|---|---|---|
| 1 | Miami-Dade County, FLMiami-Fort Lauderdale-West Palm Beach, FL | $58,300 | $2,121 | 43.7% | 51.9% | 52.8% |
| 2 | Monroe County, FLSouth Florida nonmetropolitan area | $56,590 | $1,990 | 42.2% | 50.1% | 47.8% |
| 3 | Pitkin County, CONorthwest Colorado nonmetropolitan area | $62,590 | $2,169 | 41.6% | 51.9% | 49.8% |
| 4 | Palm Beach County, FLMiami-Fort Lauderdale-West Palm Beach, FL | $58,300 | $2,008 | 41.3% | 49.1% | 48.4% |
| 5 | Buncombe County, NCAsheville, NC | $50,080 | $1,714 | 41.1% | 50.3% | 44.7% |
| 6 | Henderson County, NCAsheville, NC | $50,080 | $1,714 | 41.1% | 50.3% | 44.7% |
| 7 | Madison County, NCAsheville, NC | $50,080 | $1,714 | 41.1% | 50.3% | 44.7% |
| 8 | Santa Cruz County, CASanta Cruz-Watsonville, CA | $99,260 | $3,390 | 41.0% | 56.1% | 51.4% |
| 9 | Routt County, CONorthwest Colorado nonmetropolitan area | $62,590 | $2,119 | 40.6% | 50.7% | 45.7% |
| 10 | Summit County, CONorthwest Colorado nonmetropolitan area | $62,590 | $2,114 | 40.5% | 50.6% | 53.0% |
Most affordable
| # | County | Median pay | 1BR rent | 1BR, % of pay | 1BR, % of take-home | 2BR, % of pay |
|---|---|---|---|---|---|---|
| 1 | Stevens County, WASpokane-Spokane Valley, WA | $98,800 | $878 | 10.7% | 13.7% | 13.6% |
| 2 | Ferry County, WAEastern Washington nonmetropolitan area | $88,870 | $809 | 10.9% | 13.8% | 14.3% |
| 3 | Modoc County, CANorth Valley-Northern Mountains Region of California nonmetropolitan area | $91,200 | $856 | 11.3% | 15.2% | 14.3% |
| 4 | Trinity County, CANorth Valley-Northern Mountains Region of California nonmetropolitan area | $91,200 | $881 | 11.6% | 15.6% | 15.2% |
| 5 | Garfield County, WAEastern Washington nonmetropolitan area | $88,870 | $874 | 11.8% | 15.0% | 15.4% |
| 6 | Meigs County, OHSouthern Ohio nonmetropolitan area | $77,820 | $767 | 11.8% | 14.9% | 15.5% |
| 7 | Vinton County, OHSouthern Ohio nonmetropolitan area | $77,820 | $767 | 11.8% | 14.9% | 15.5% |
| 8 | Paulding County, OHWest Northwestern Ohio nonmetropolitan area | $77,380 | $767 | 11.9% | 14.9% | 15.6% |
| 9 | Preble County, OHWest Northwestern Ohio nonmetropolitan area | $77,380 | $767 | 11.9% | 14.9% | 15.6% |
| 10 | Jackson County, OHSouthern Ohio nonmetropolitan area | $77,820 | $772 | 11.9% | 15.0% | 15.5% |
Counties in one metro area usually share both the pay figure and the Fair Market Rent, so they often tie. Pay is BLS's median for the county's pay area (by place of work); take-home is after 2026 federal and state tax for a single filer.
Teachers and police, state by state
Counties where a one-bedroom takes more than 30% of a median-paid elementary school teacher's and police officer's pay before tax, and the least affordable county in each state (reliable BLS figures only). Every job is in the finder above and in the CSV.
| State | Counties | Elementary teachers | Police officers | ||
|---|---|---|---|---|---|
| Over 30% | Least affordable, 1BR % of pay | Over 30% | Least affordable, 1BR % of pay | ||
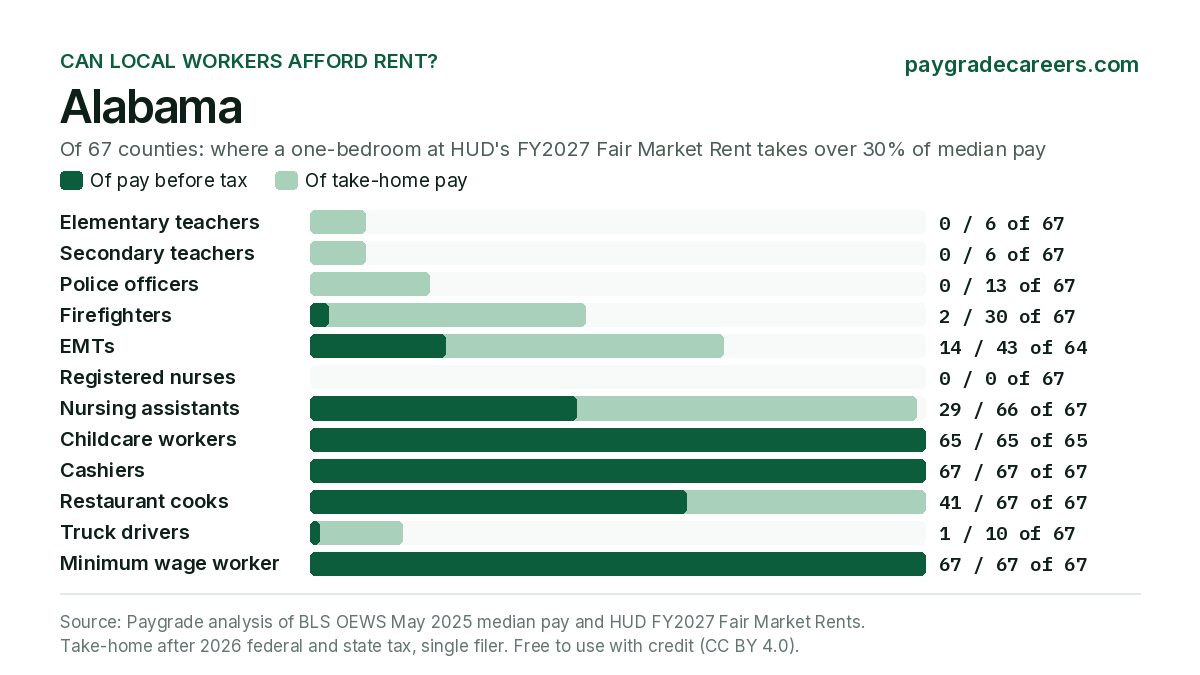
| Alabama | 67 | 0 of 67 | Bibb County and 4 more 24.2% | 0 of 67 | Baldwin County 26.9% |
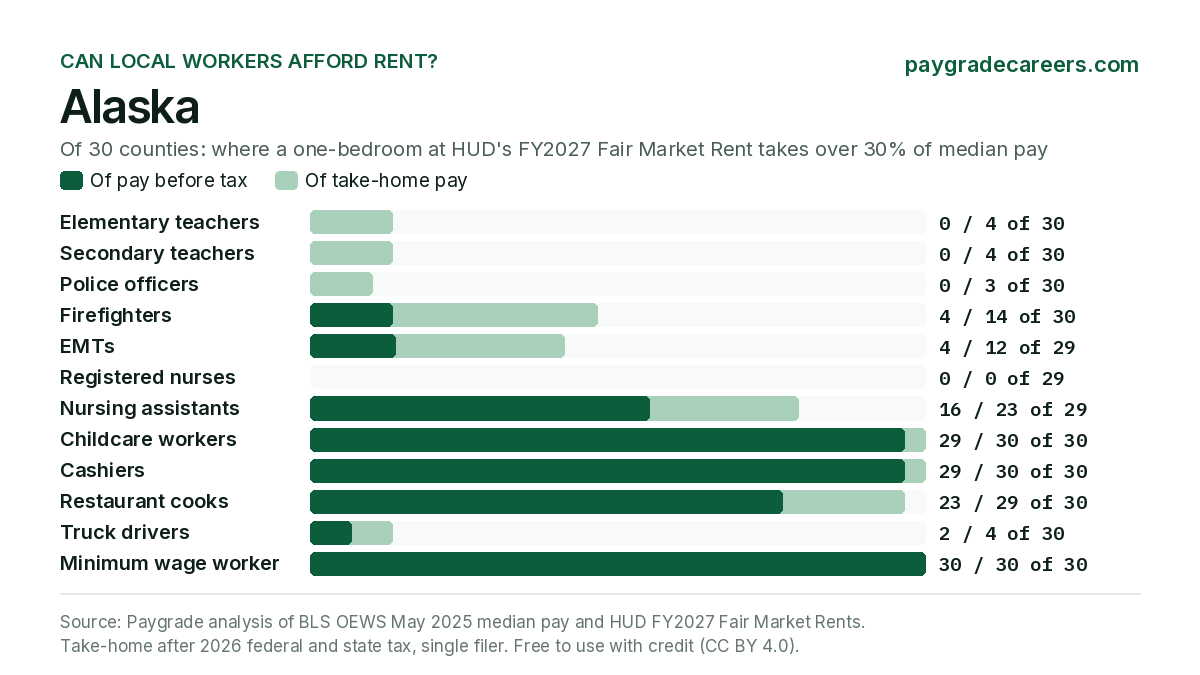
| Alaska | 30 | 0 of 30 | Aleutians West Census Area 27.8% | 0 of 30 | Aleutians West Census Area 26.1% |
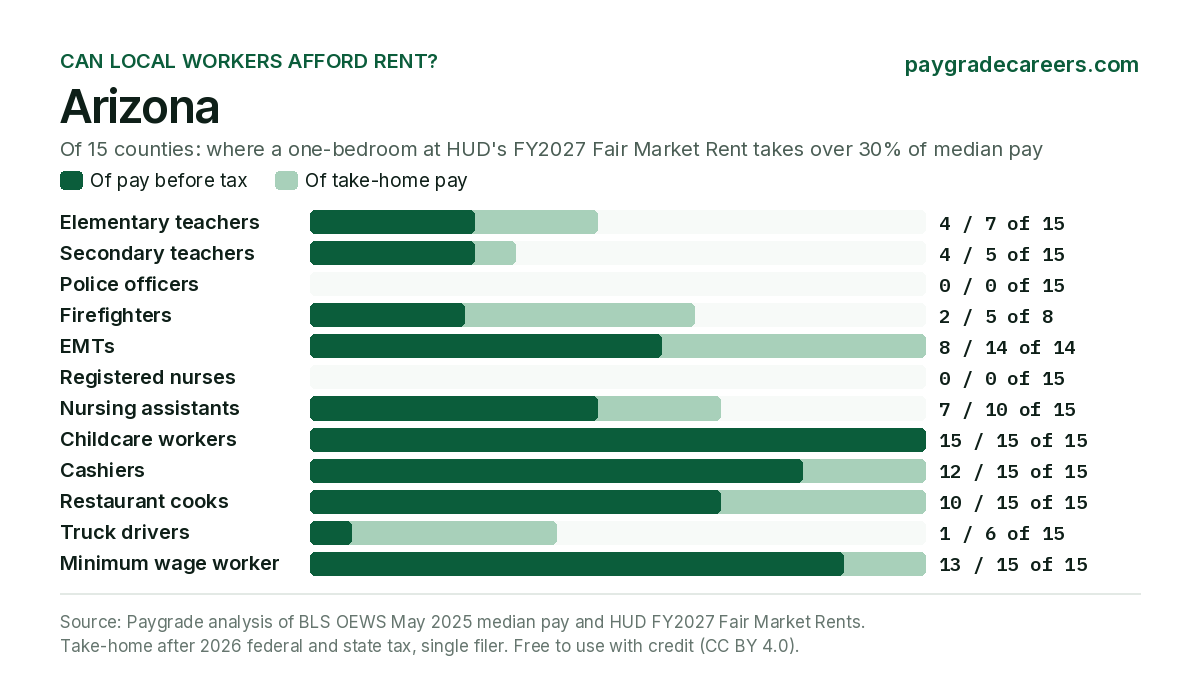
| Arizona | 15 | 4 of 15 | Coconino County 34.6% | 0 of 15 | Coconino County 23.7% |
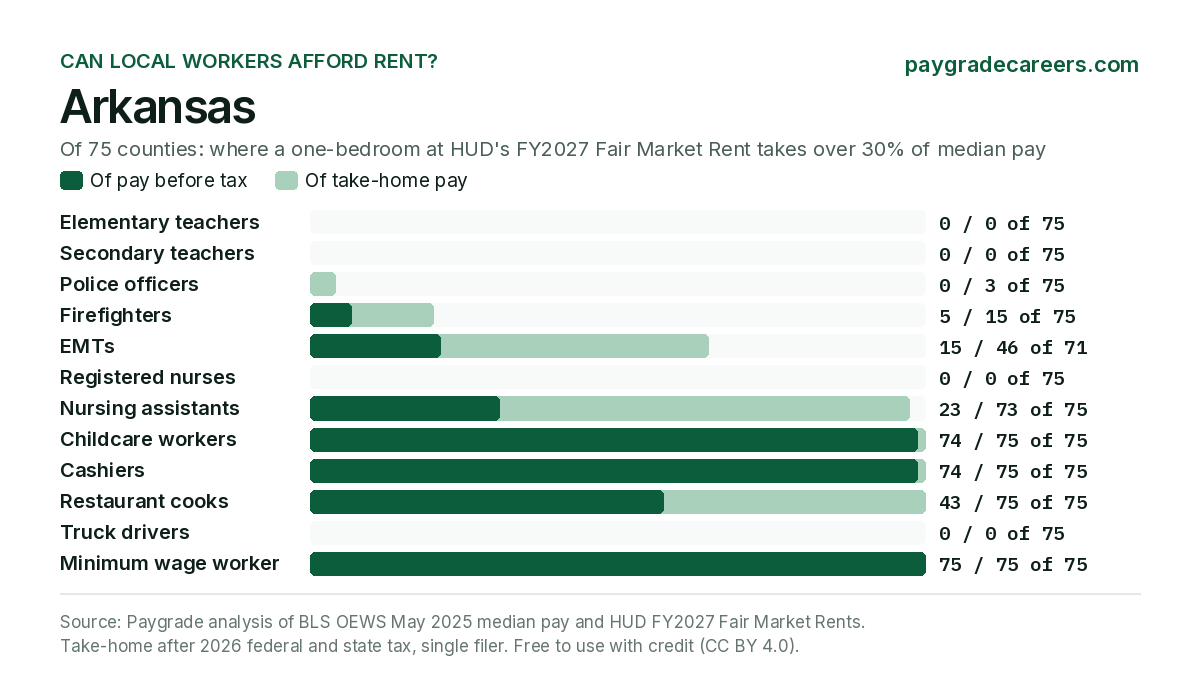
| Arkansas | 75 | 0 of 75 | Crittenden County 23.2% | 0 of 75 | Fulton County and 2 more 25.5% |
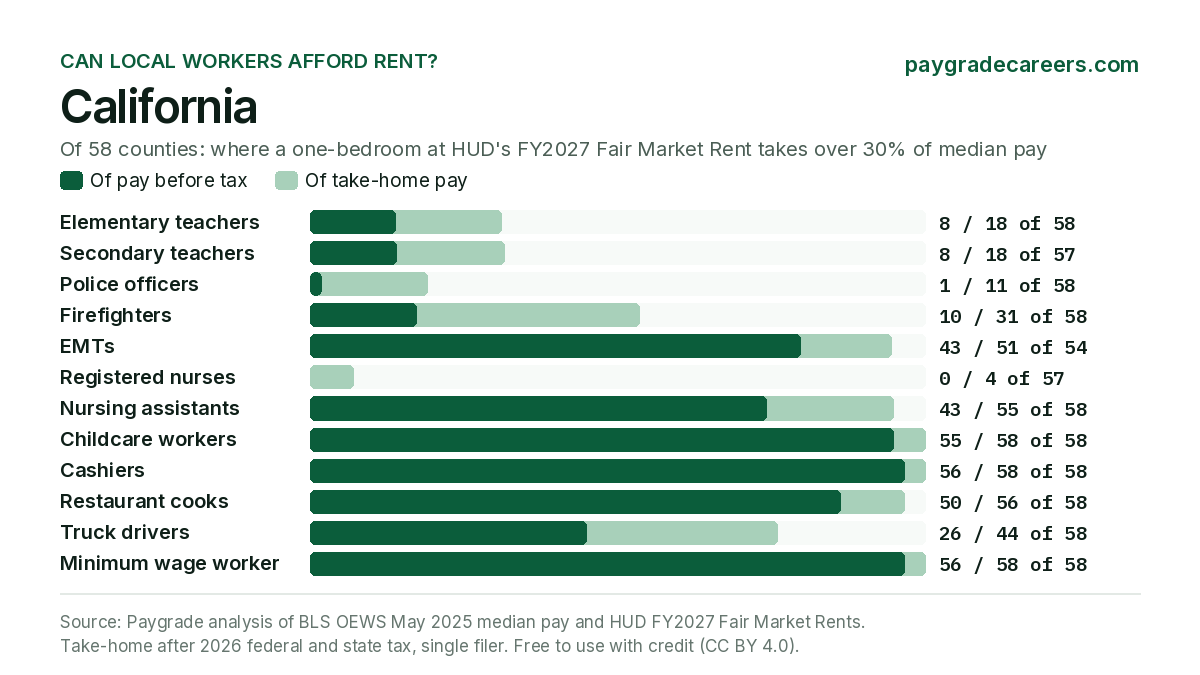
| California | 58 | 8 of 58 | Santa Cruz County 41.0% | 1 of 58 | Santa Cruz County 33.1% |
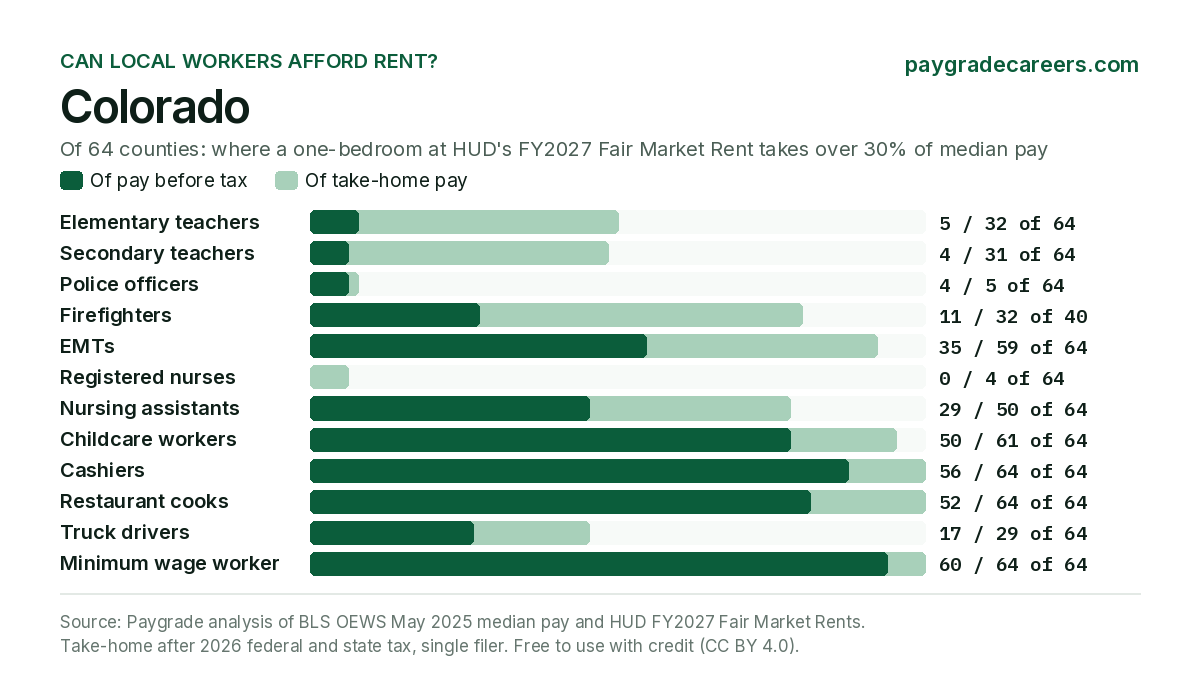
| Colorado | 64 | 5 of 64 | Pitkin County 41.6% | 4 of 64 | Pitkin County 32.8% |
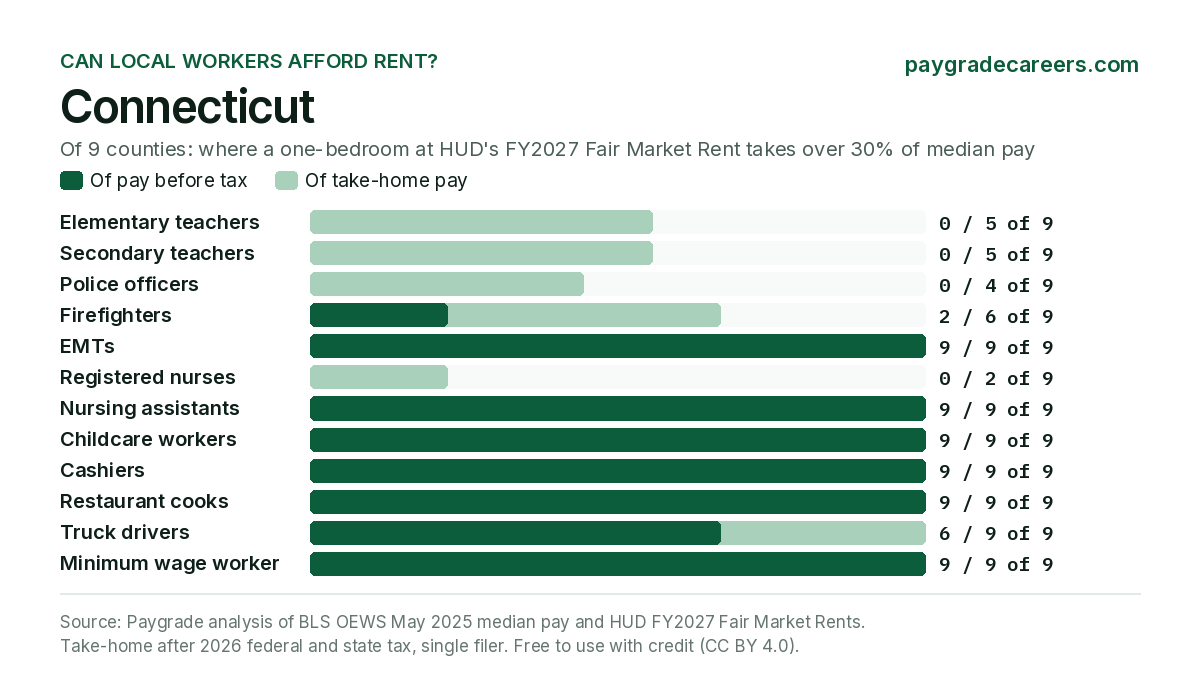
| Connecticut | 9 | 0 of 9 | South Central Connecticut Planning Region 26.2% | 0 of 9 | Greater Bridgeport Planning Region and 1 more 29.6% |
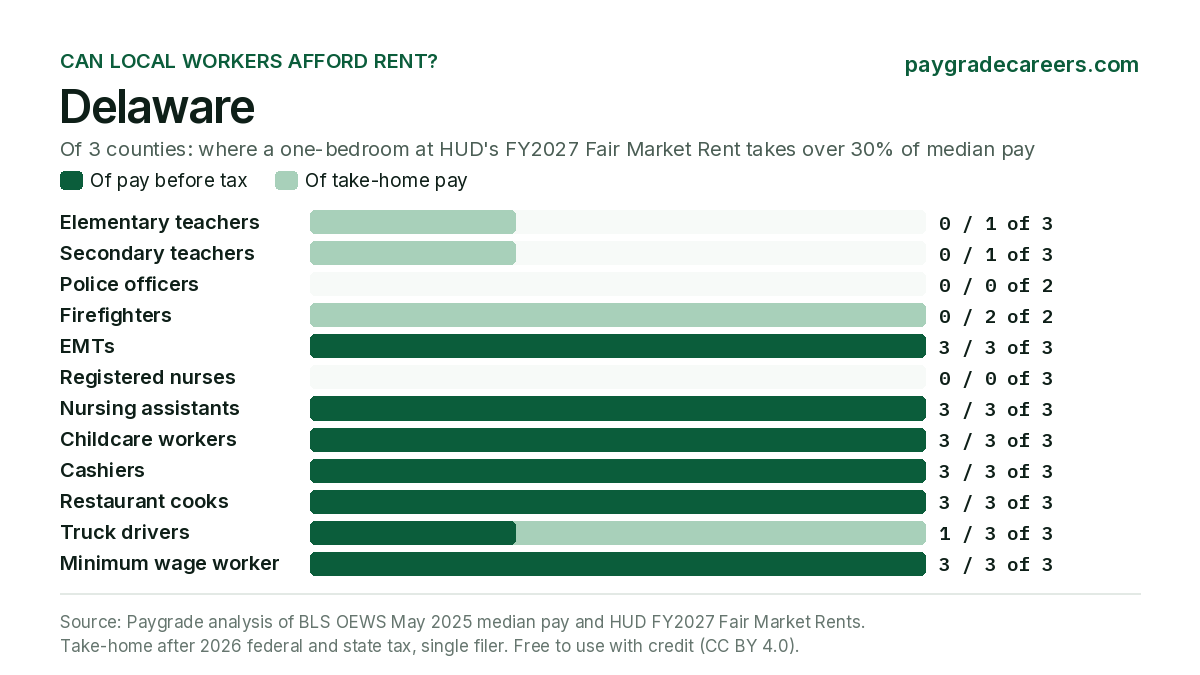
| Delaware | 3 | 0 of 3 | New Castle County 23.8% | 0 of 2 | New Castle County 20.9% |
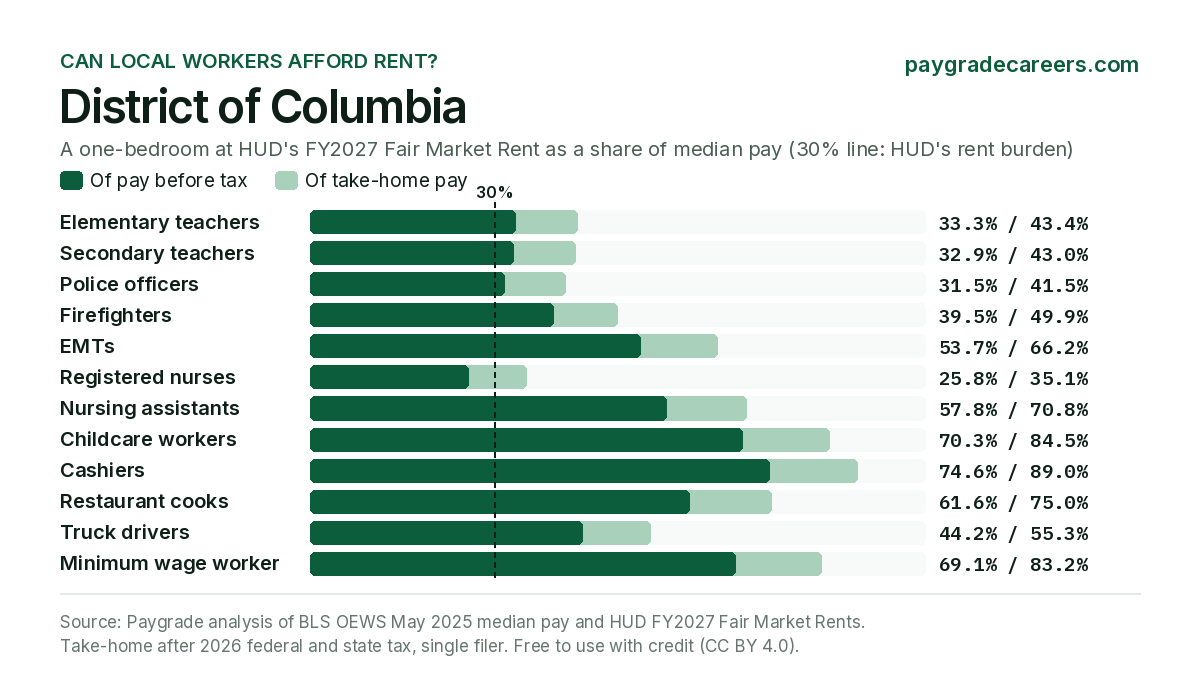
| District of Columbia | 1 | 1 of 1 | District of Columbia 33.3% | 1 of 1 | District of Columbia 31.5% |
| Florida | 67 | 23 of 65 | Miami-Dade County 43.7% | 13 of 67 | Monroe County 41.8% |
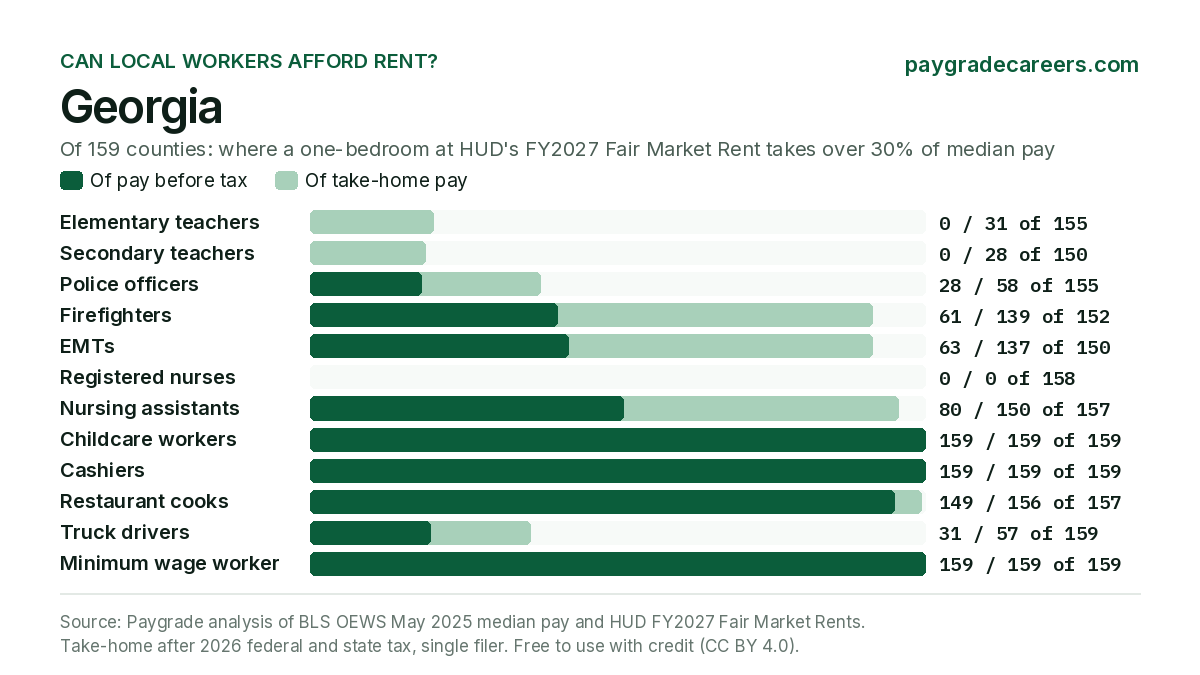
| Georgia | 159 | 0 of 155 | Bryan County and 2 more 29.0% | 28 of 155 | Camden County 31.9% |
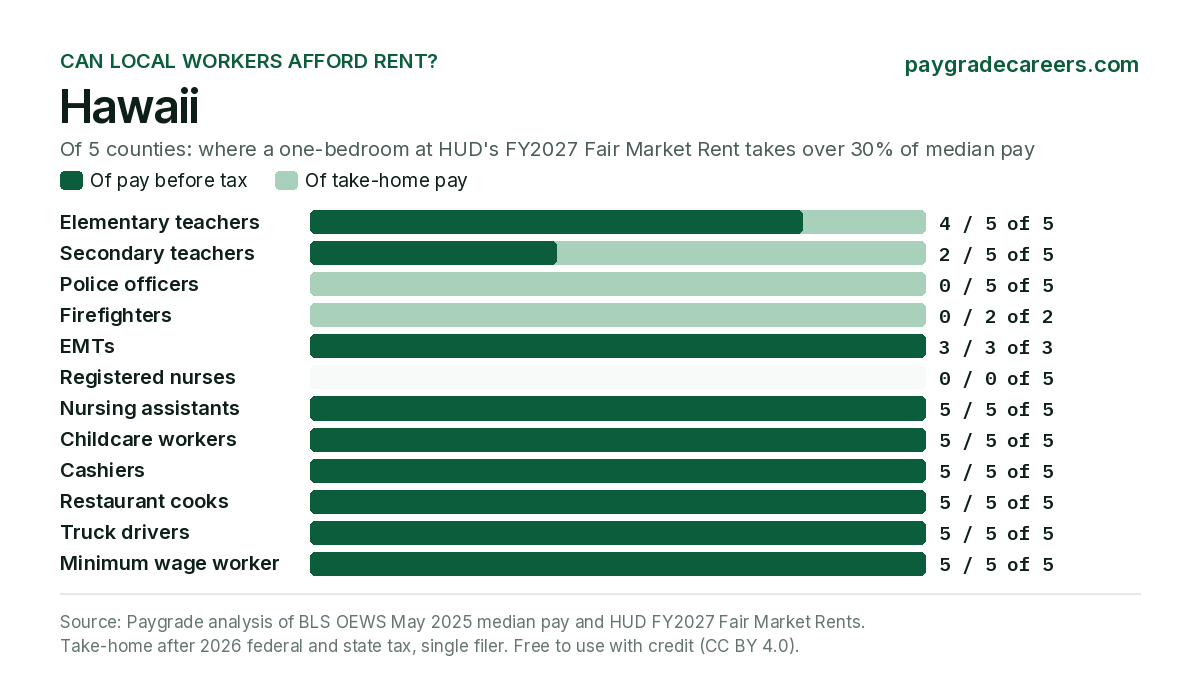
| Hawaii | 5 | 4 of 5 | Maui County 33.9% | 0 of 5 | Maui County 29.1% |
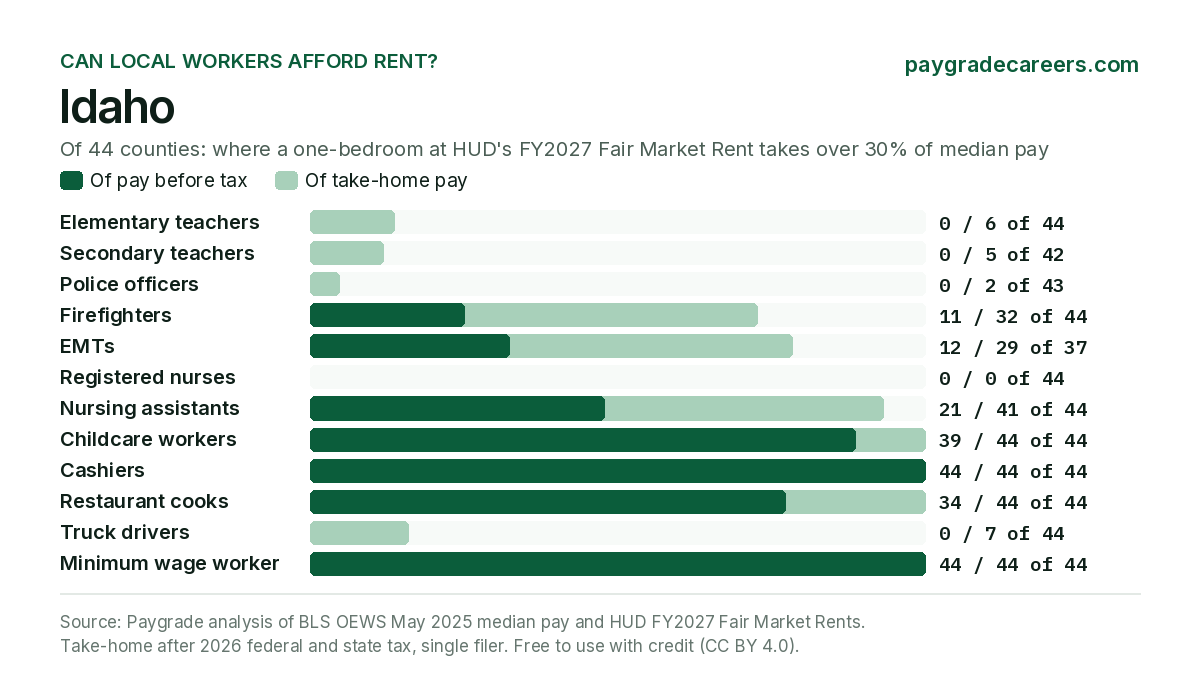
| Idaho | 44 | 0 of 44 | Ada County and 3 more 25.4% | 0 of 43 | Blaine County 26.3% |
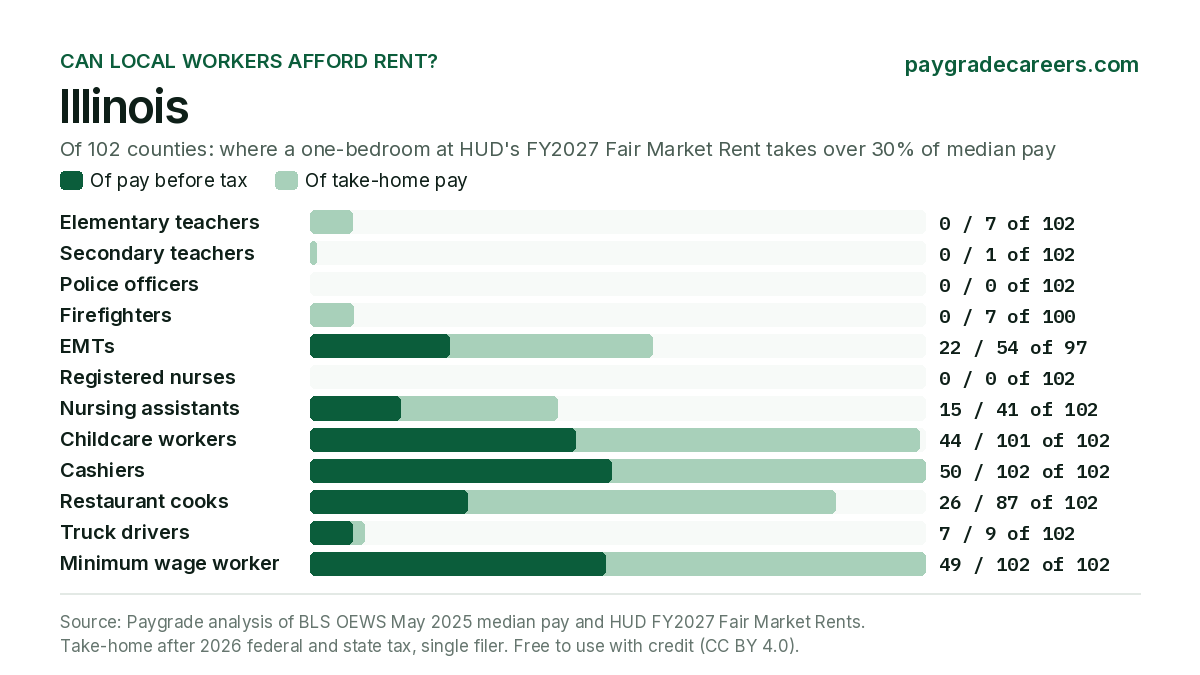
| Illinois | 102 | 0 of 102 | Kendall County 27.4% | 0 of 102 | Kendall County 19.9% |
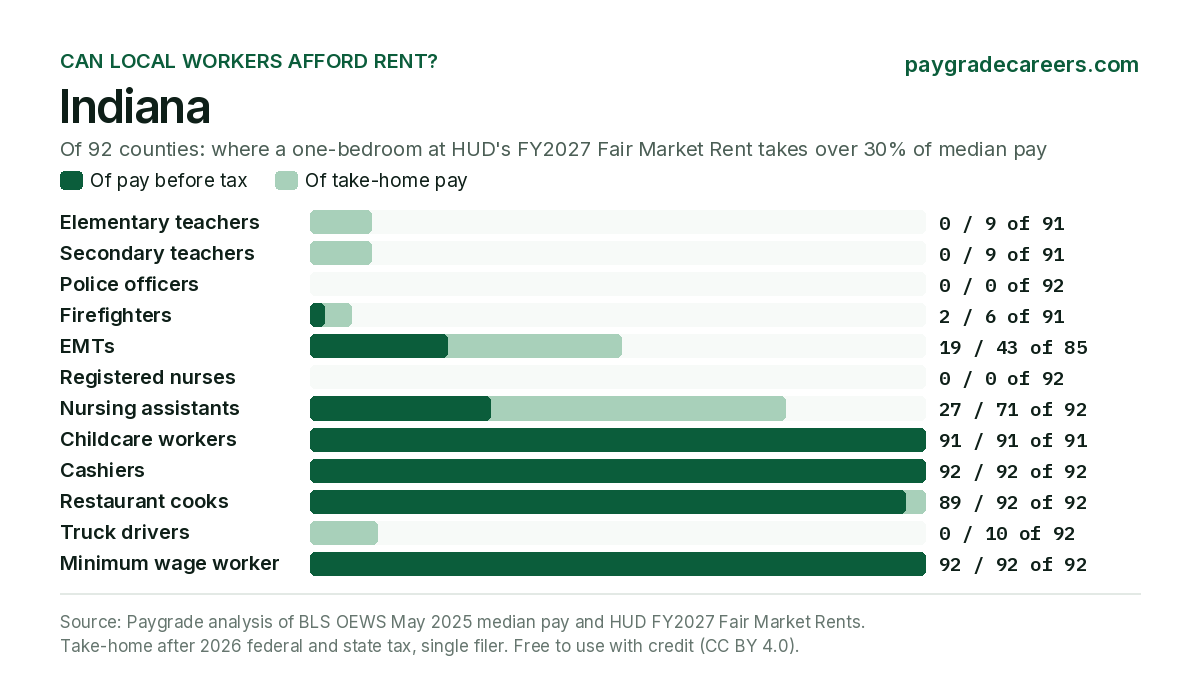
| Indiana | 92 | 0 of 91 | Boone County and 8 more 26.5% | 0 of 92 | Bartholomew County 21.1% |
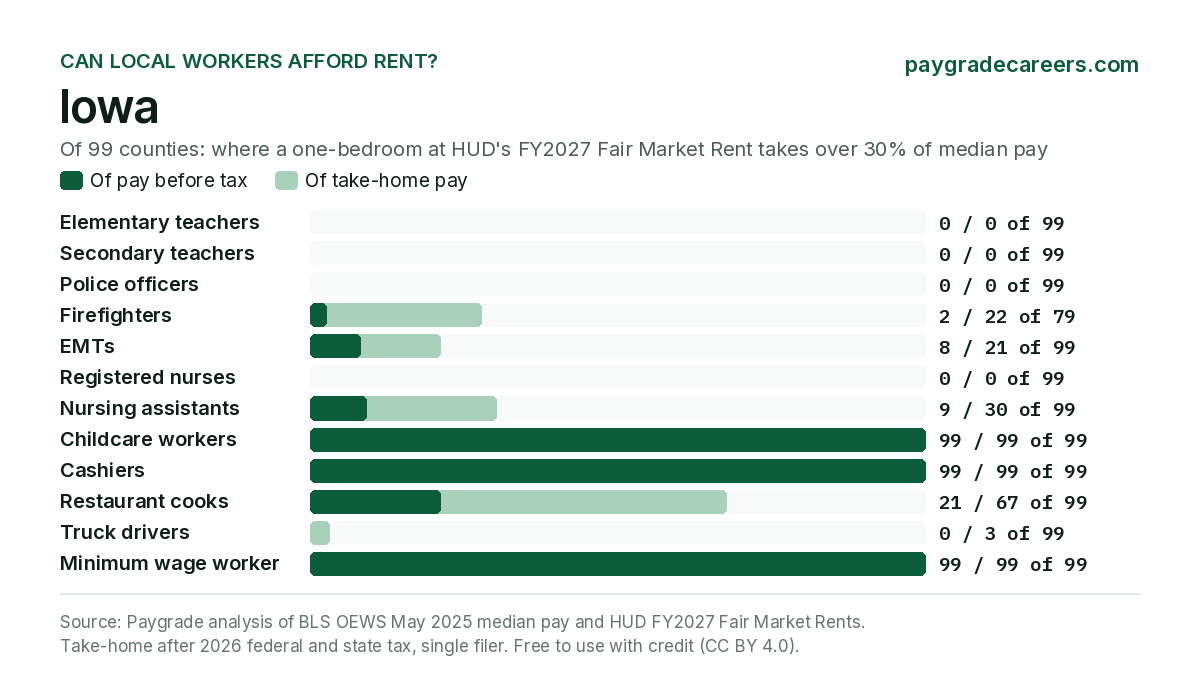
| Iowa | 99 | 0 of 99 | Harrison County and 2 more 23.3% | 0 of 99 | Harrison County and 2 more 18.2% |
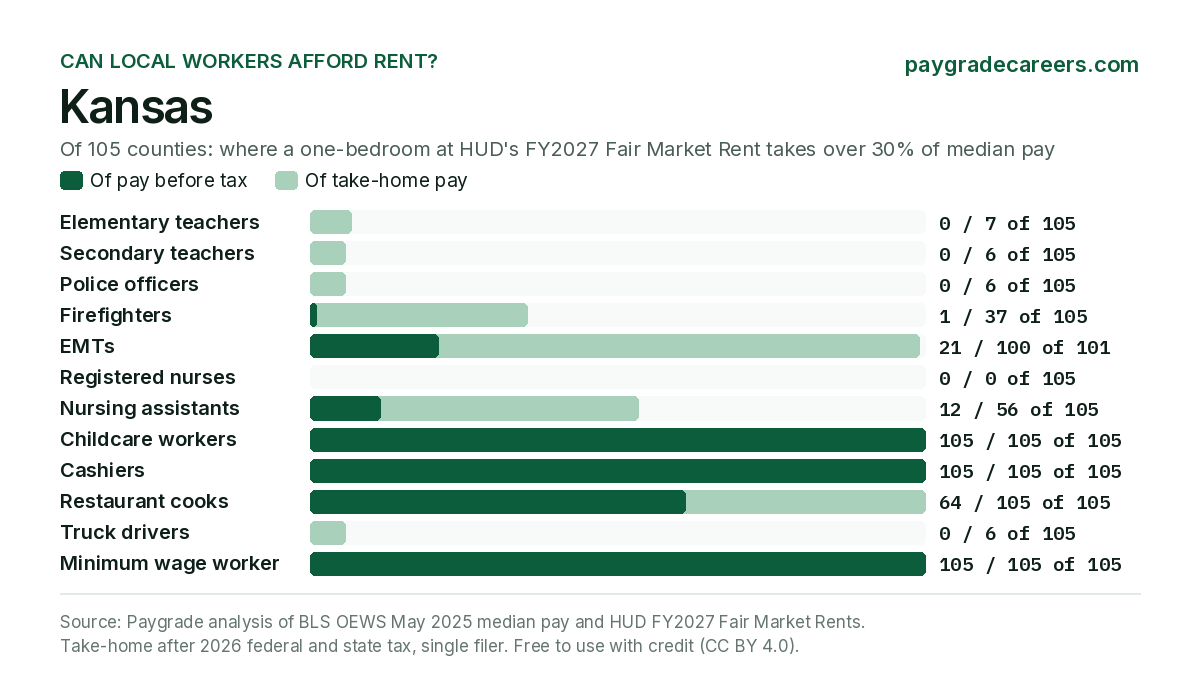
| Kansas | 105 | 0 of 105 | Kearny County 28.3% | 0 of 105 | Kearny County 28.8% |
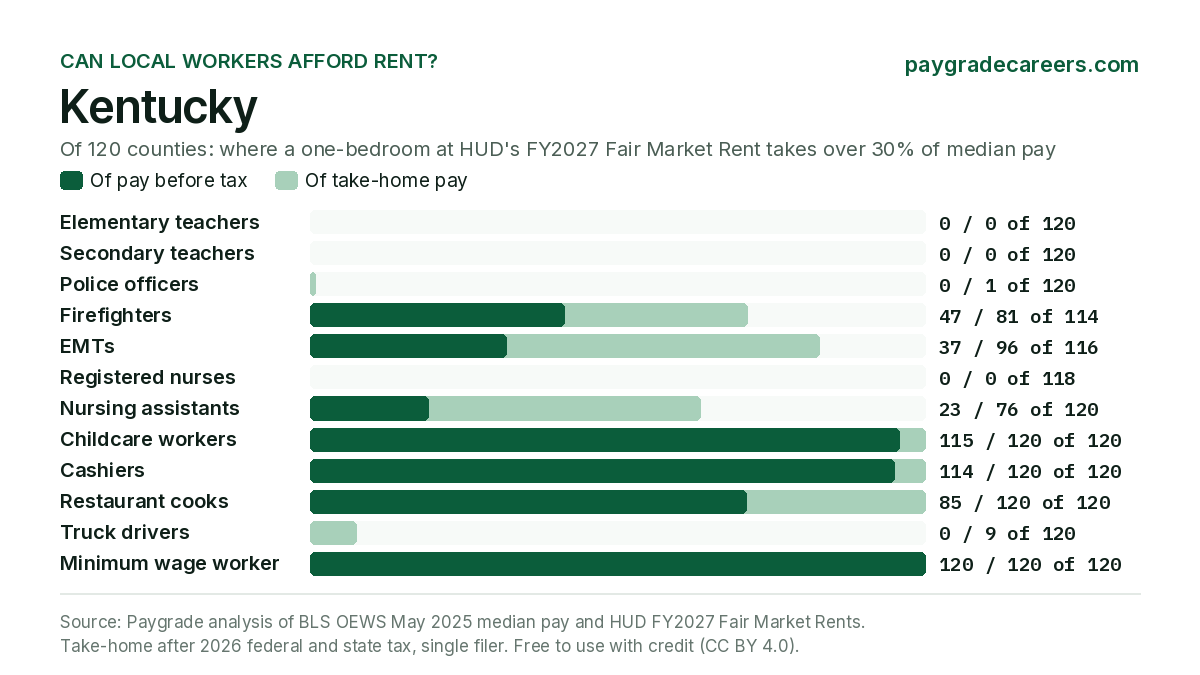
| Kentucky | 120 | 0 of 120 | Bourbon County and 5 more 23.5% | 0 of 120 | Simpson County 24.9% |
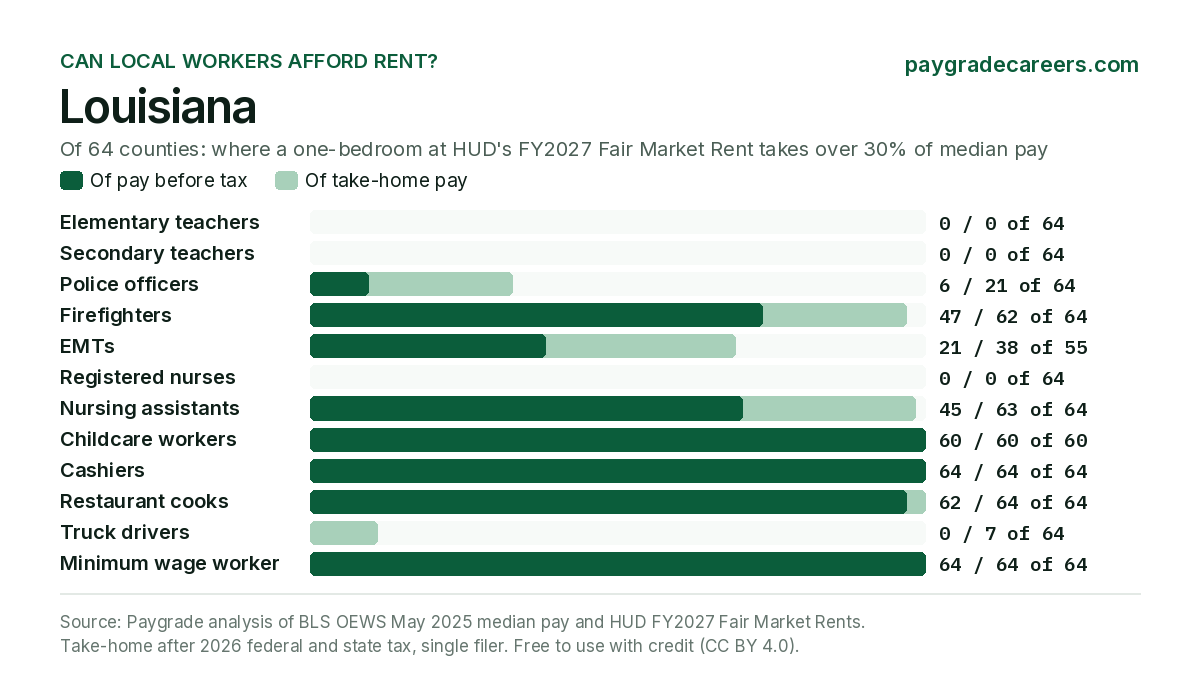
| Louisiana | 64 | 0 of 64 | Jefferson Parish and 5 more 24.4% | 6 of 64 | Jefferson Parish and 5 more 30.1% |
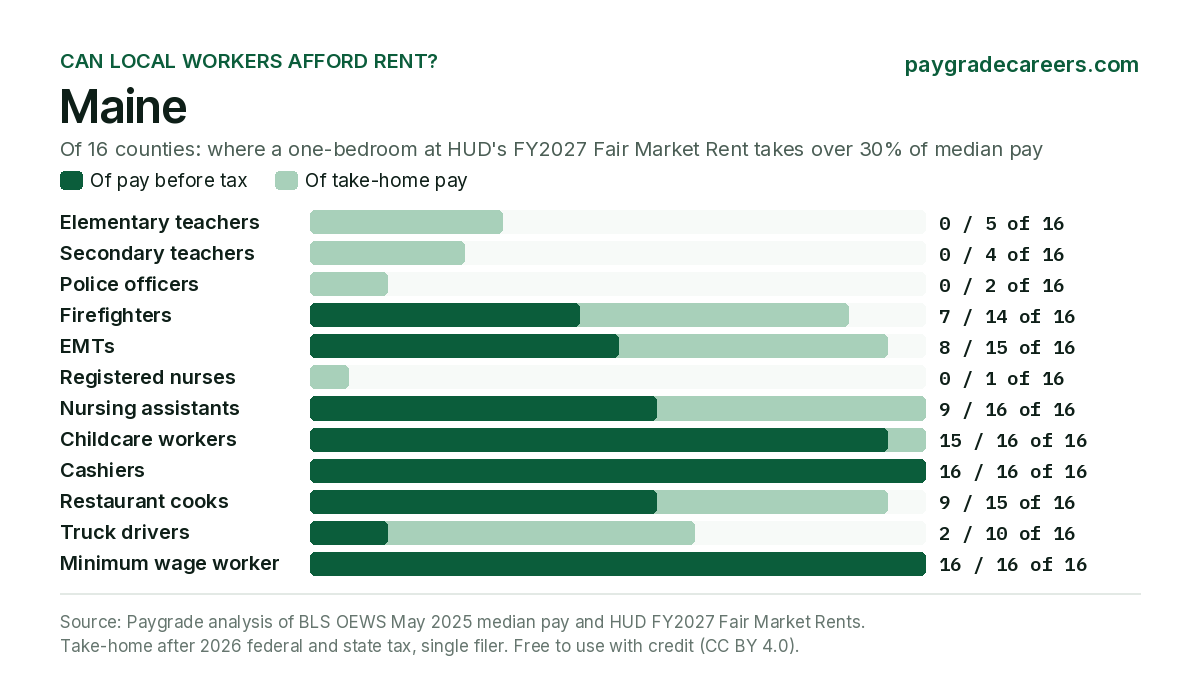
| Maine | 16 | 0 of 16 | Cumberland County 28.4% | 0 of 16 | Cumberland County 29.6% |
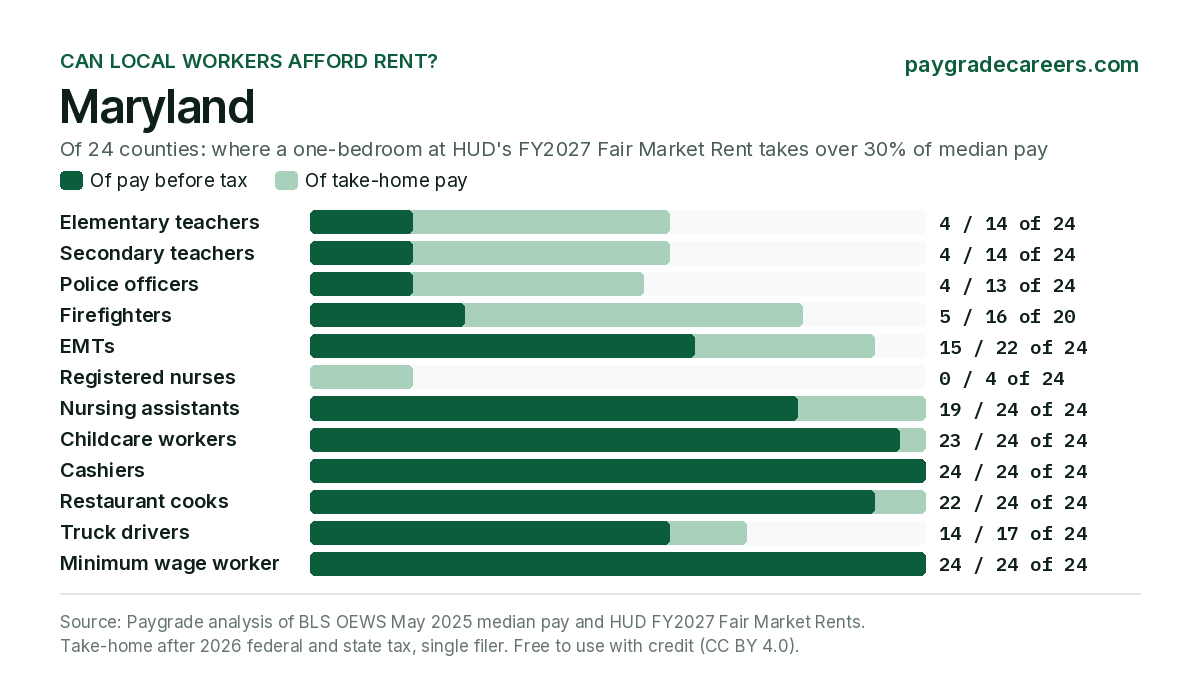
| Maryland | 24 | 4 of 24 | Charles County and 3 more 33.3% | 4 of 24 | Charles County and 3 more 31.5% |
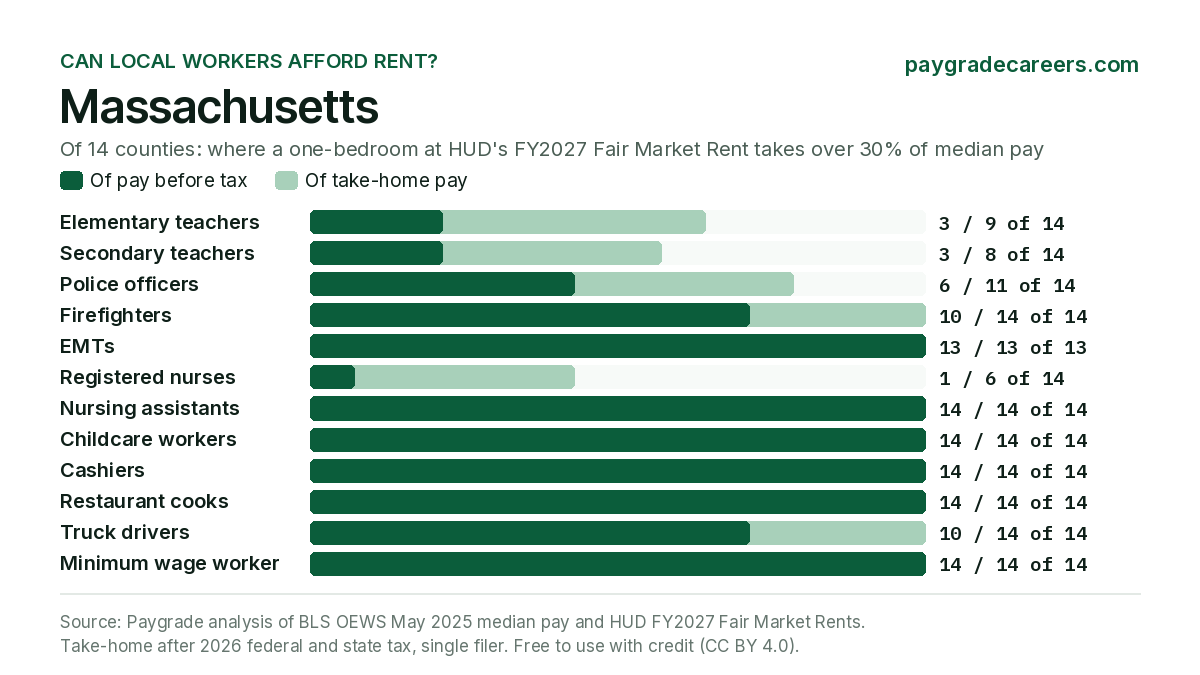
| Massachusetts | 14 | 3 of 14 | Nantucket County 33.0% | 6 of 14 | Nantucket County 43.9% |
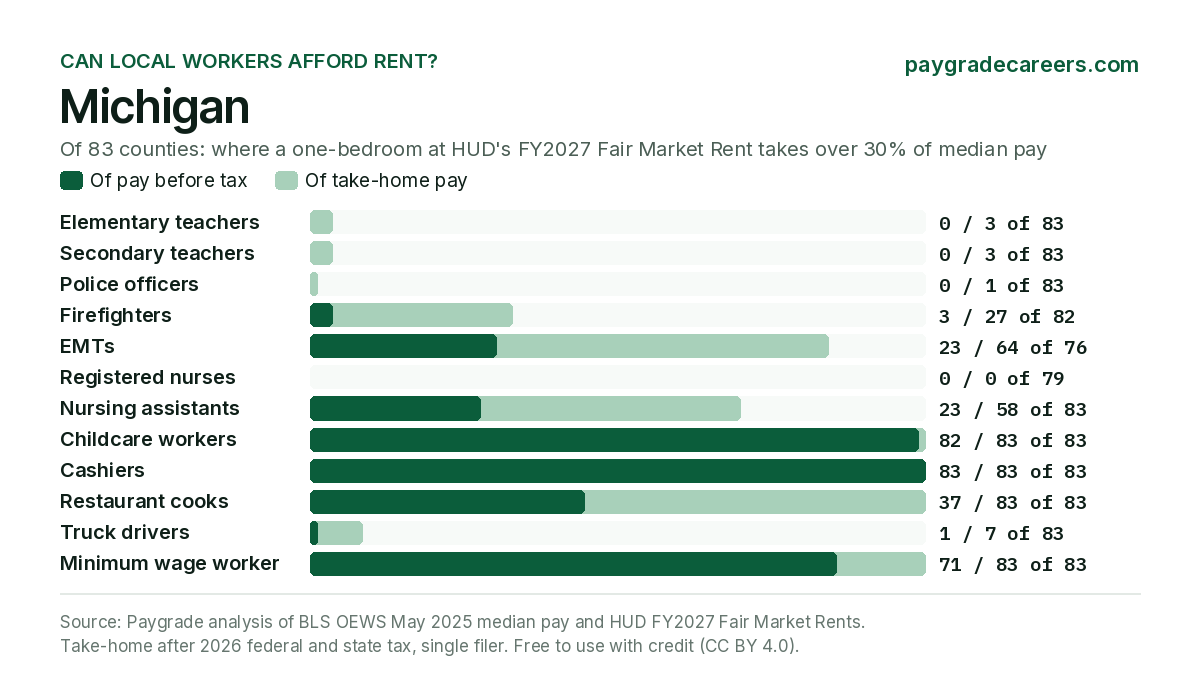
| Michigan | 83 | 0 of 83 | Washtenaw County 28.1% | 0 of 83 | Washtenaw County 24.2% |
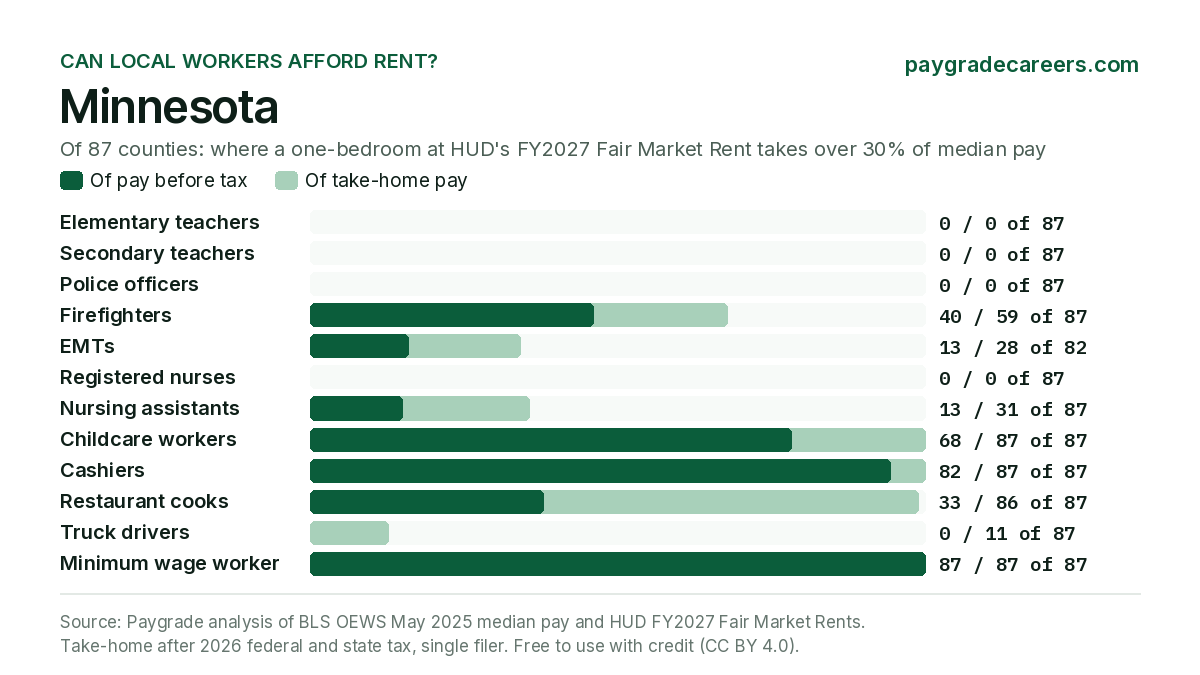
| Minnesota | 87 | 0 of 87 | Anoka County and 10 more 21.5% | 0 of 87 | Dodge County and 1 more 19.1% |
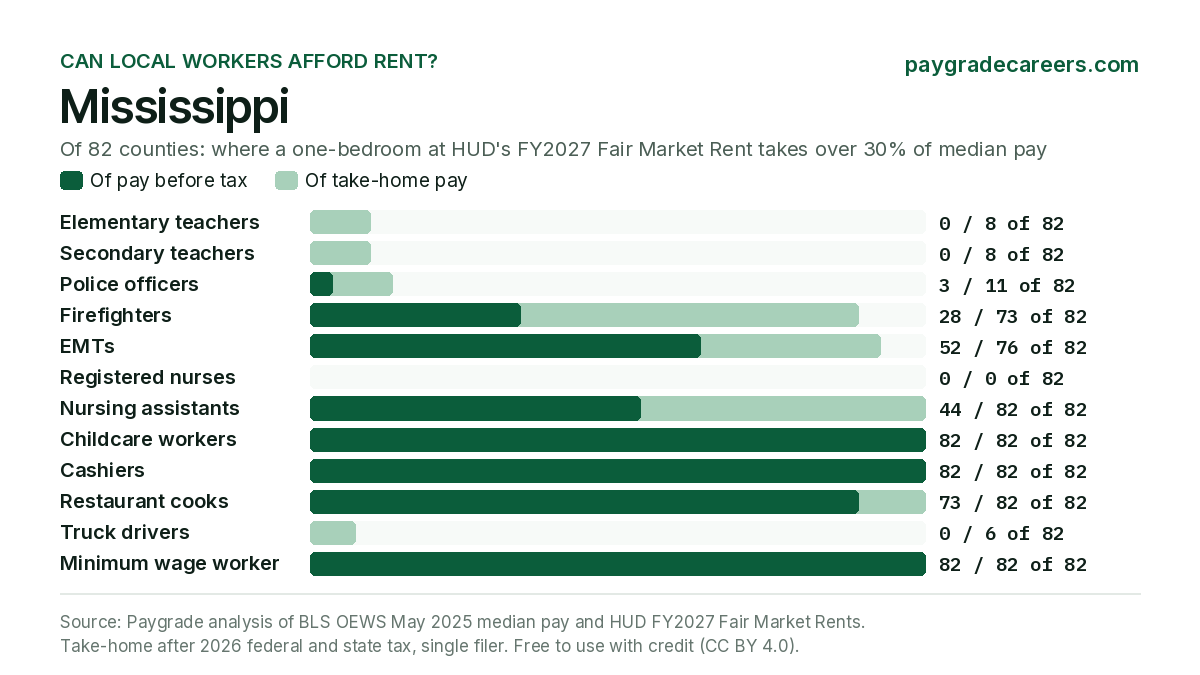
| Mississippi | 82 | 0 of 82 | Forrest County and 2 more 28.1% | 3 of 82 | Forrest County and 2 more 30.4% |
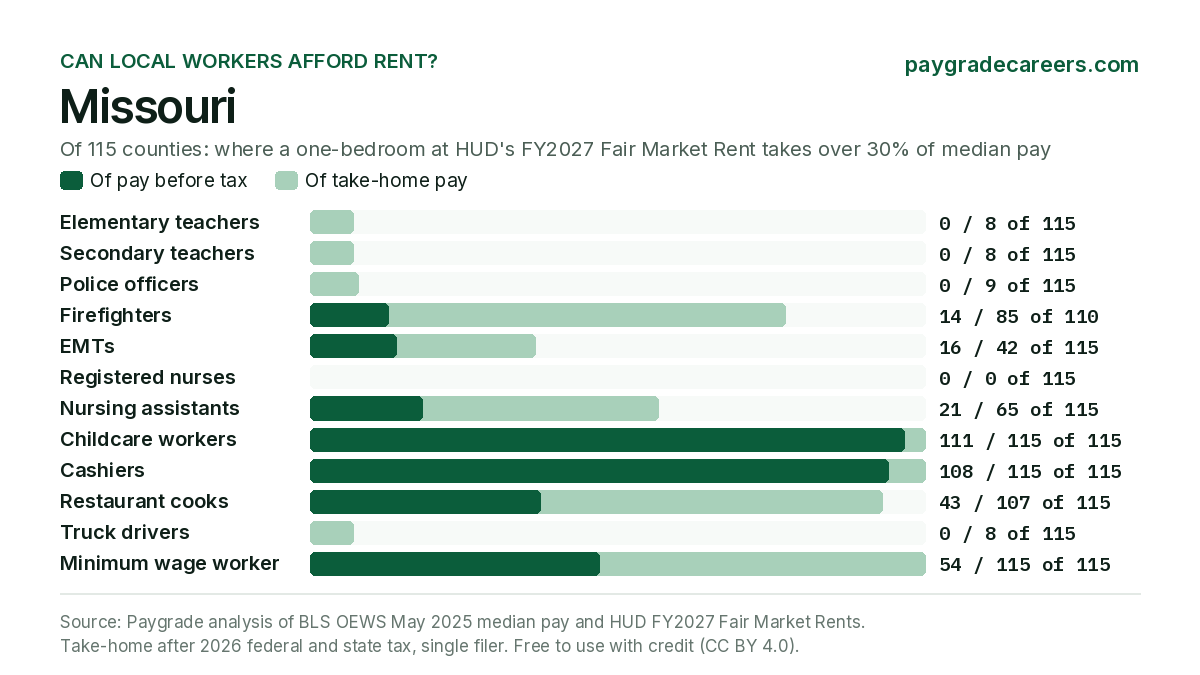
| Missouri | 115 | 0 of 115 | Caldwell County and 7 more 26.9% | 0 of 115 | Caldwell County and 7 more 26.0% |
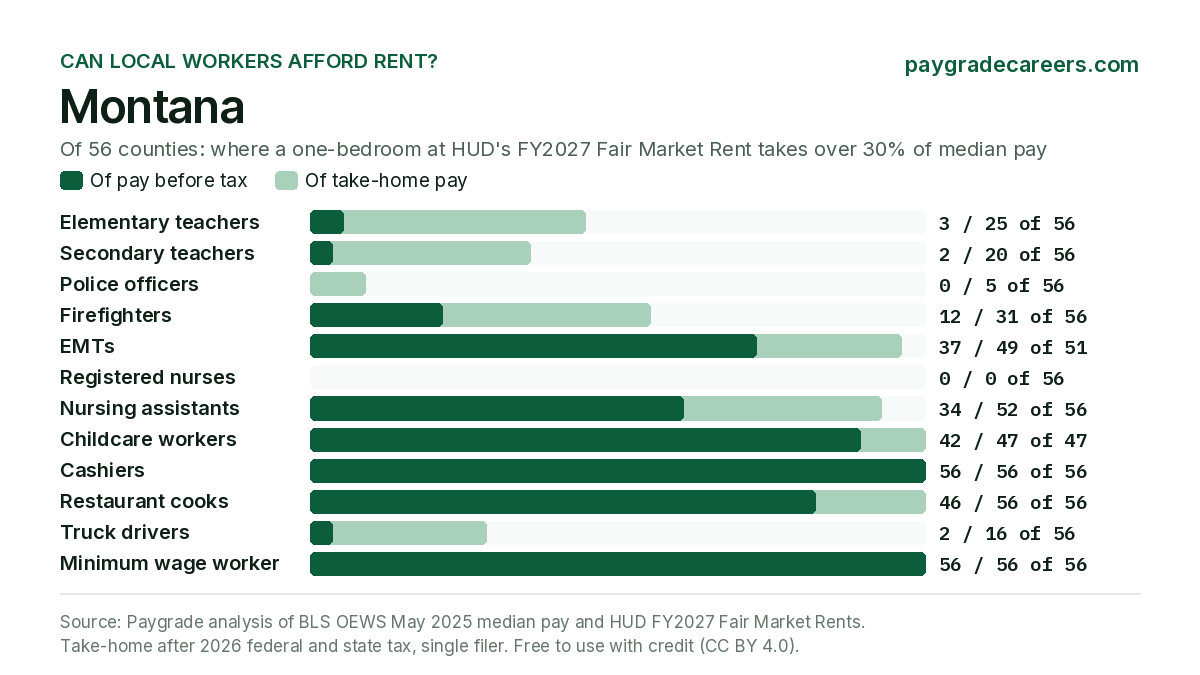
| Montana | 56 | 3 of 56 | Broadwater County 33.4% | 0 of 56 | Park County 26.3% |
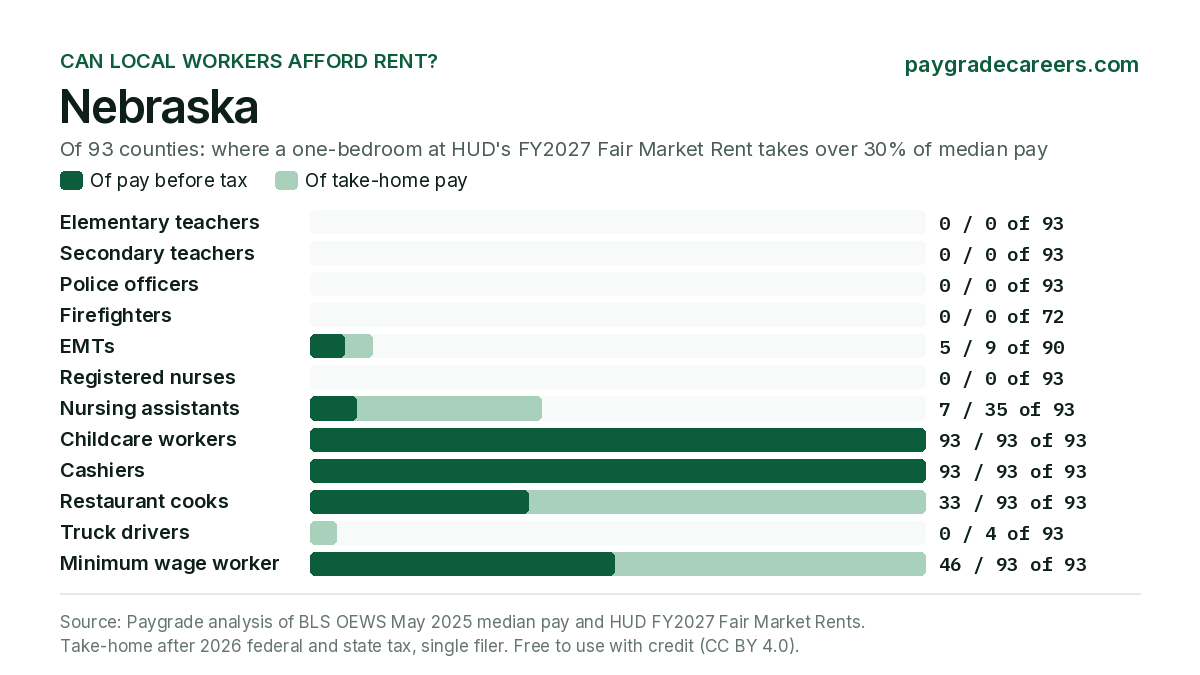
| Nebraska | 93 | 0 of 93 | Cass County and 3 more 23.3% | 0 of 93 | Colfax County 18.9% |
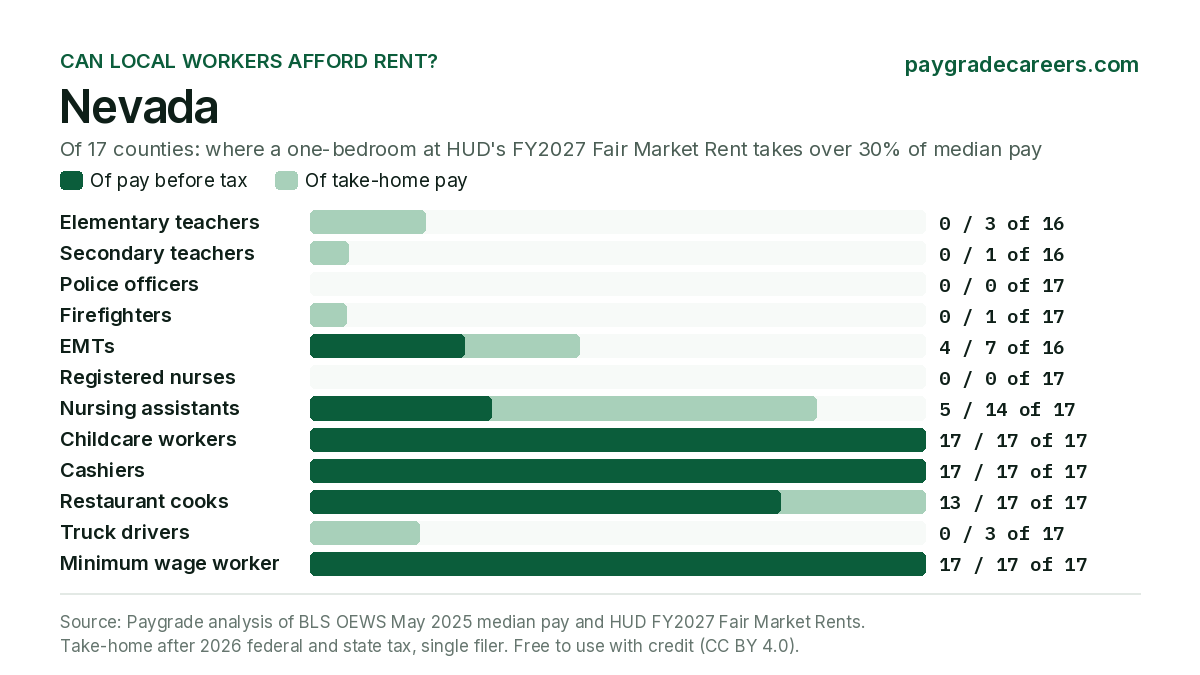
| Nevada | 17 | 0 of 16 | Storey County and 1 more 28.1% | 0 of 17 | Clark County 22.1% |
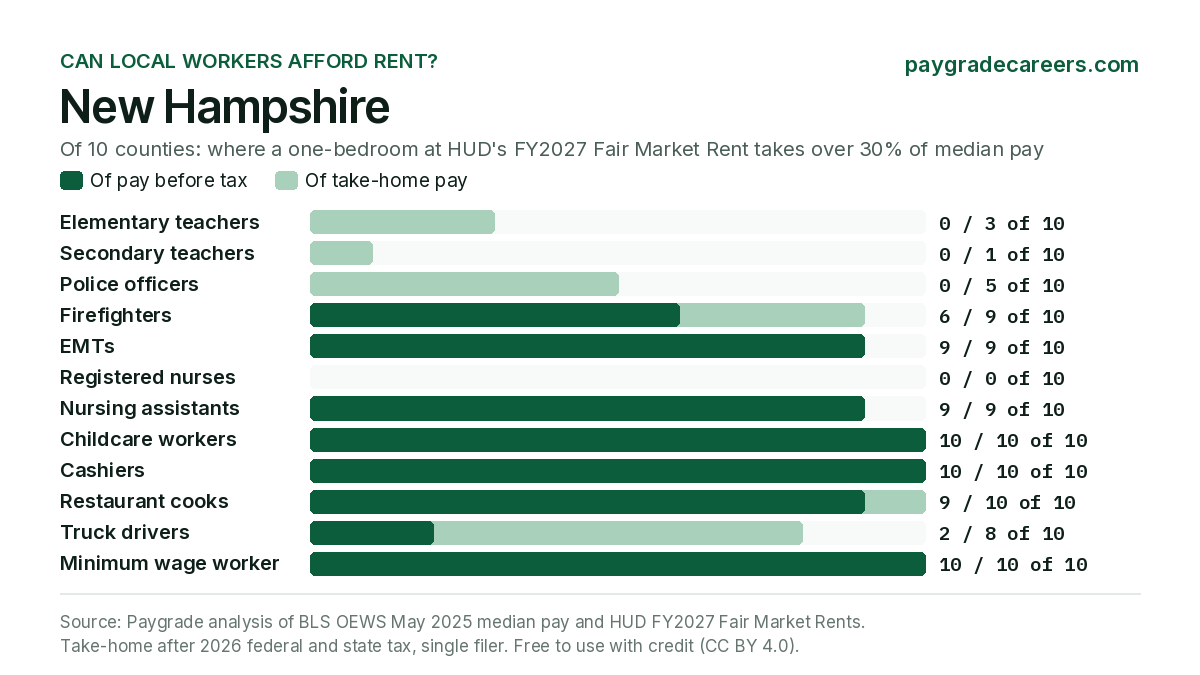
| New Hampshire | 10 | 0 of 10 | Hillsborough County 28.1% | 0 of 10 | Hillsborough County 27.8% |
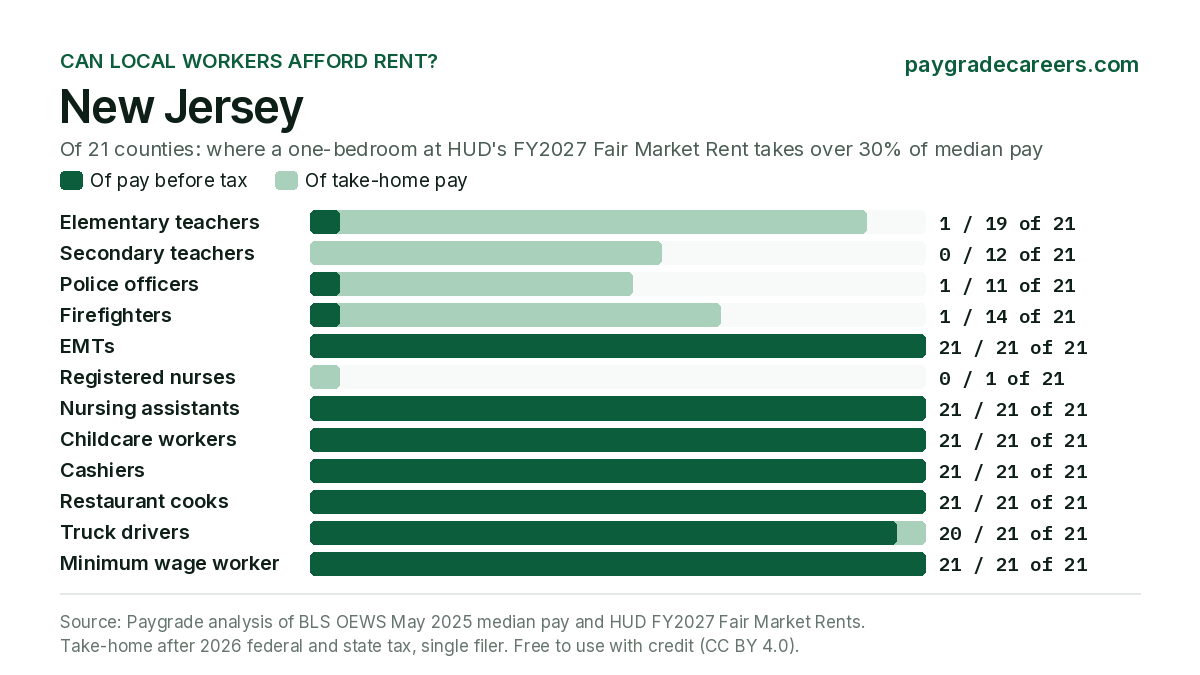
| New Jersey | 21 | 1 of 21 | Hudson County 31.1% | 1 of 21 | Mercer County 30.6% |
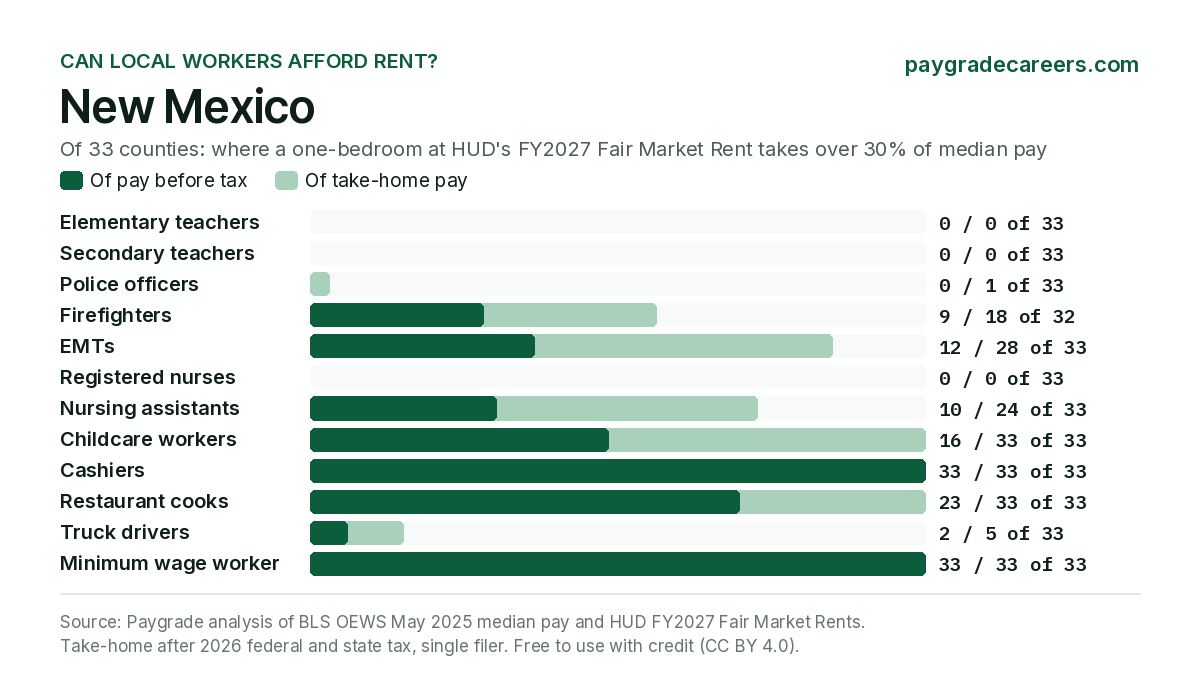
| New Mexico | 33 | 0 of 33 | Santa Fe County 23.0% | 0 of 33 | Los Alamos County 28.9% |
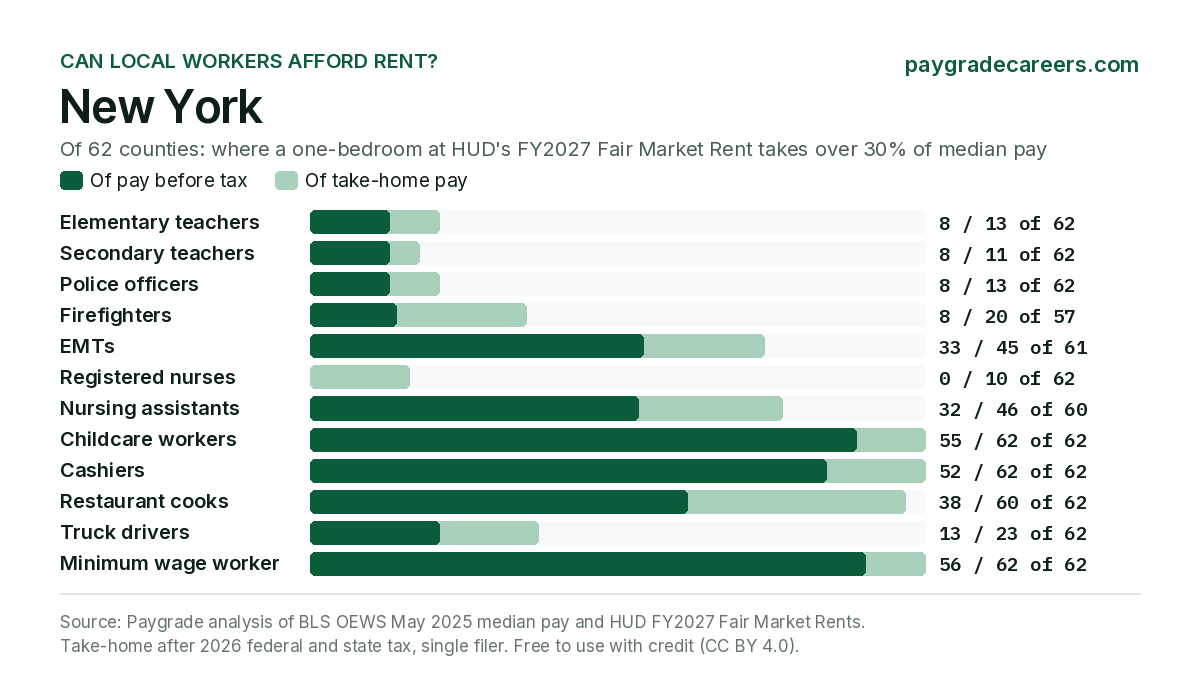
| New York | 62 | 8 of 62 | Bronx County and 7 more 33.8% | 8 of 62 | Bronx County and 7 more 31.0% |
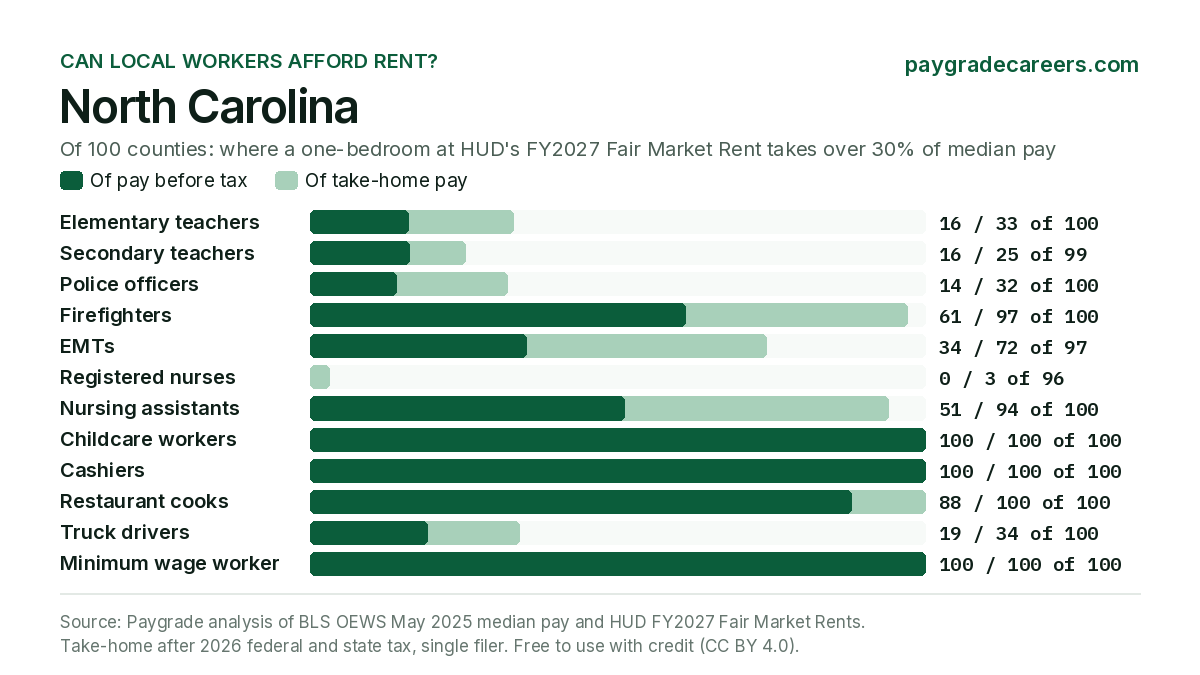
| North Carolina | 100 | 16 of 100 | Buncombe County and 2 more 41.1% | 14 of 100 | Buncombe County and 2 more 35.4% |
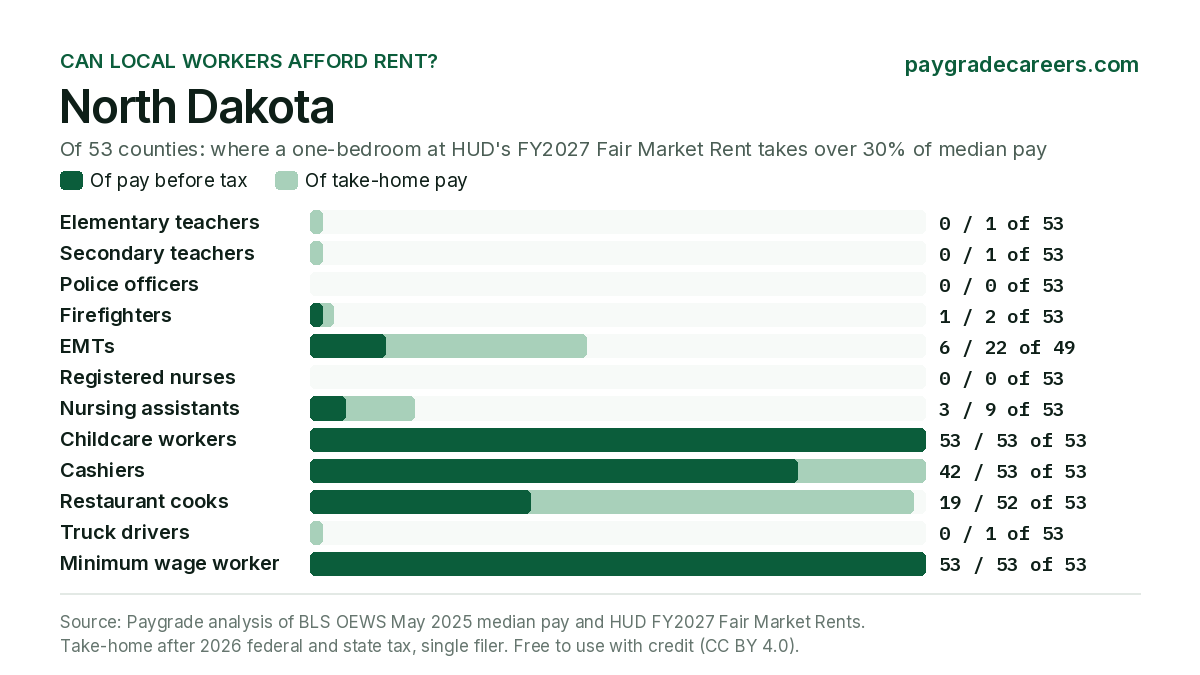
| North Dakota | 53 | 0 of 53 | Divide County 29.2% | 0 of 53 | Divide County 22.9% |
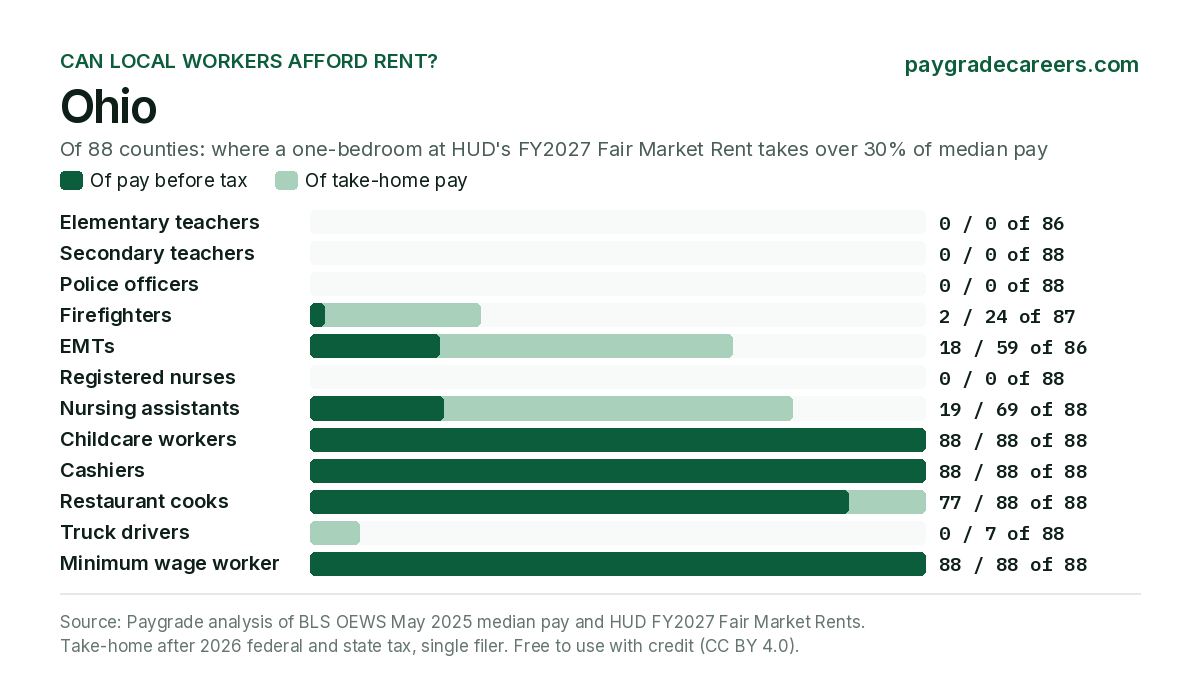
| Ohio | 88 | 0 of 86 | Butler County and 3 more 20.9% | 0 of 88 | Athens County 19.1% |
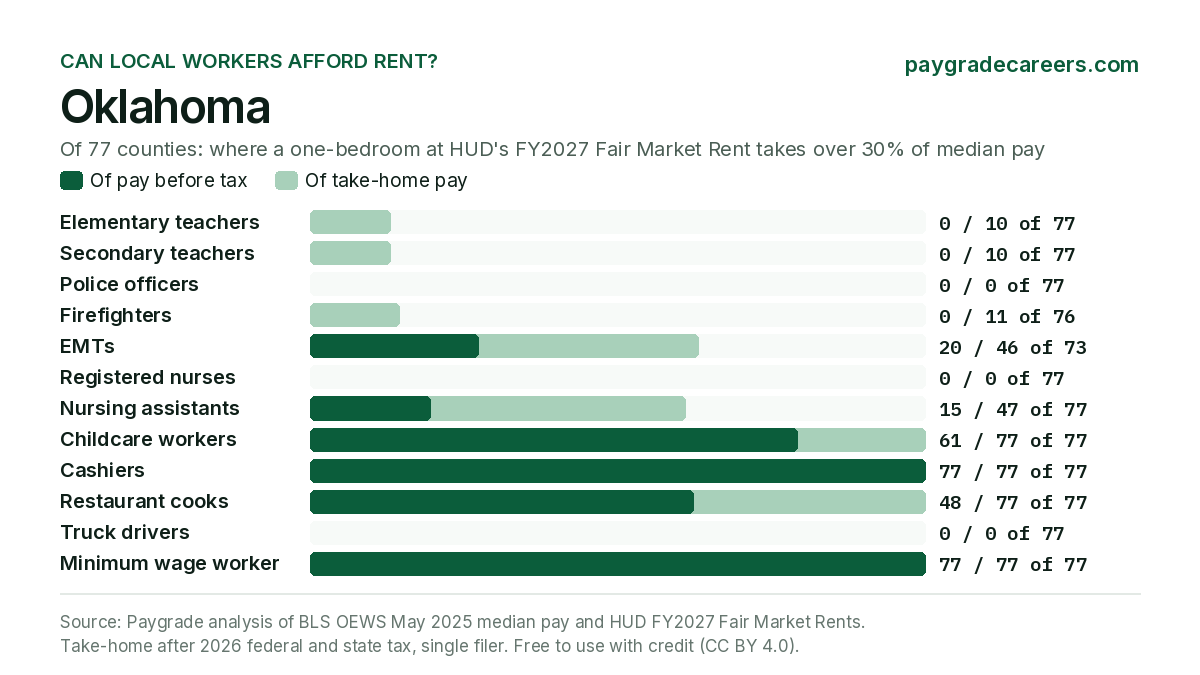
| Oklahoma | 77 | 0 of 77 | Canadian County and 4 more 25.6% | 0 of 77 | Texas County 23.1% |
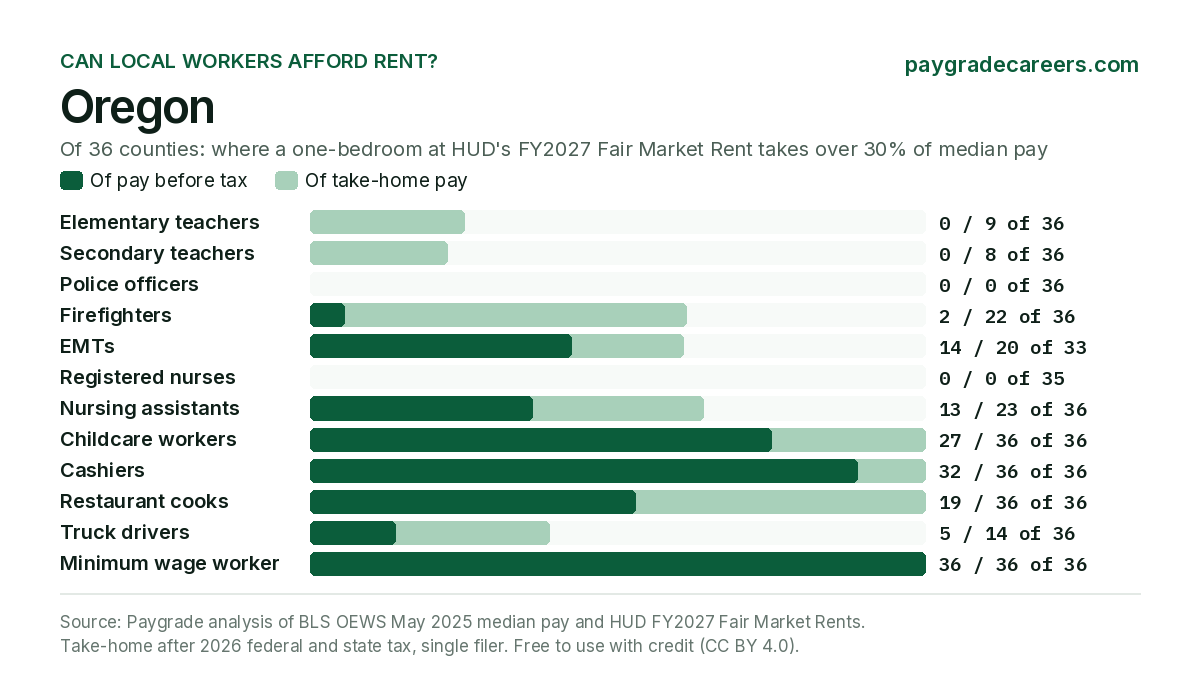
| Oregon | 36 | 0 of 36 | Clackamas County and 4 more 23.8% | 0 of 36 | Hood River County 22.3% |
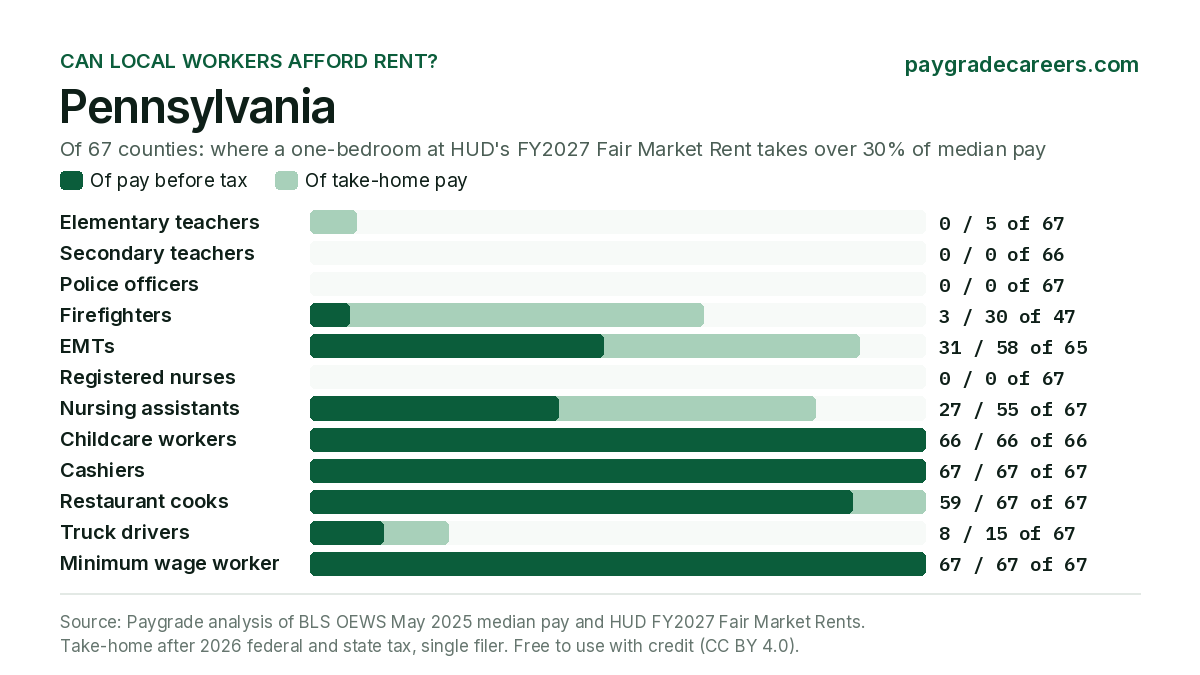
| Pennsylvania | 67 | 0 of 67 | Bucks County and 4 more 23.8% | 0 of 67 | Centre County 21.8% |
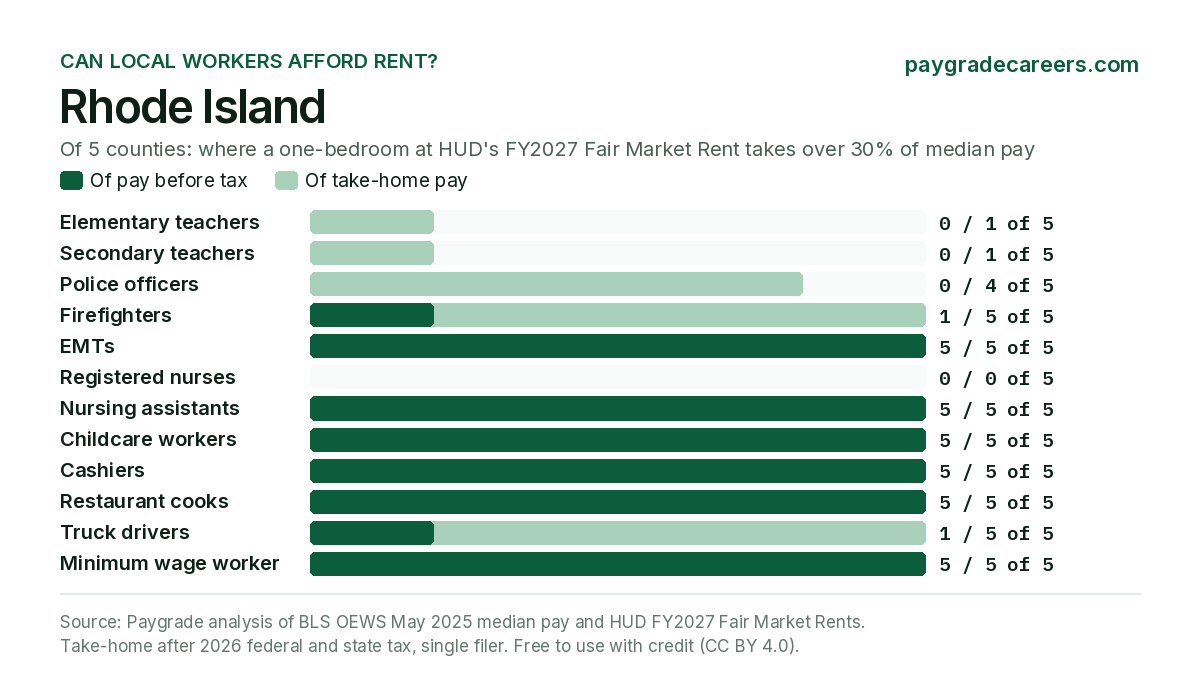
| Rhode Island | 5 | 0 of 5 | Newport County 24.8% | 0 of 5 | Newport County 28.0% |
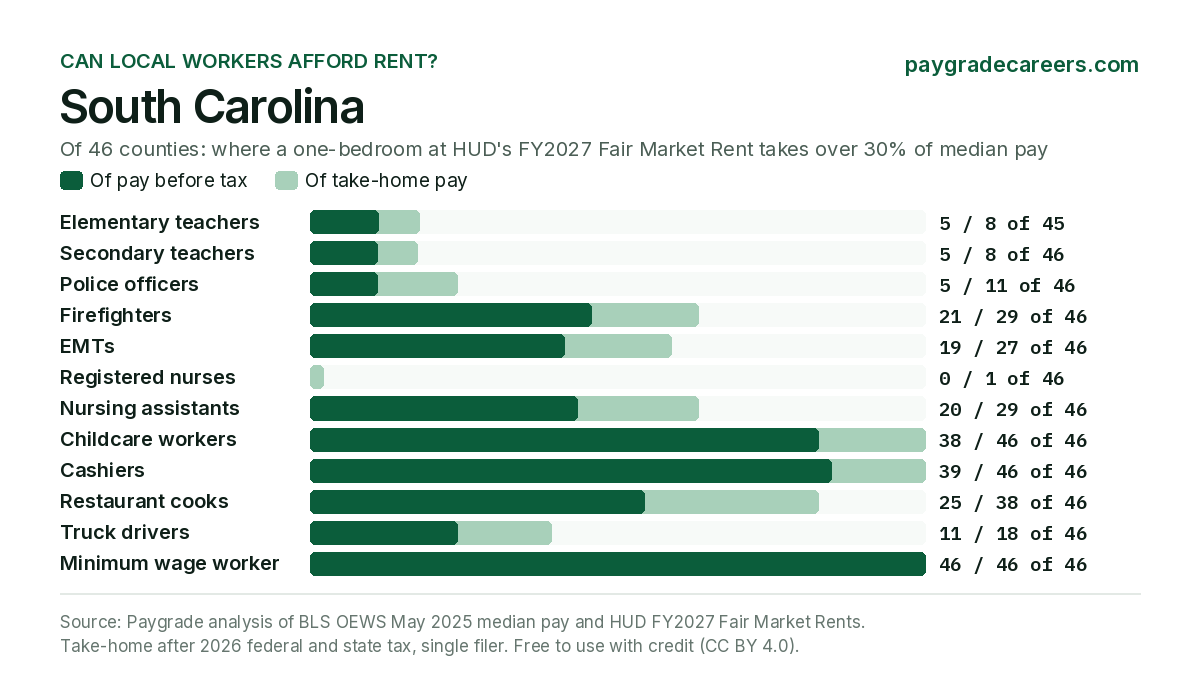
| South Carolina | 46 | 5 of 45 | Beaufort County 34.0% | 5 of 46 | Beaufort County 37.4% |
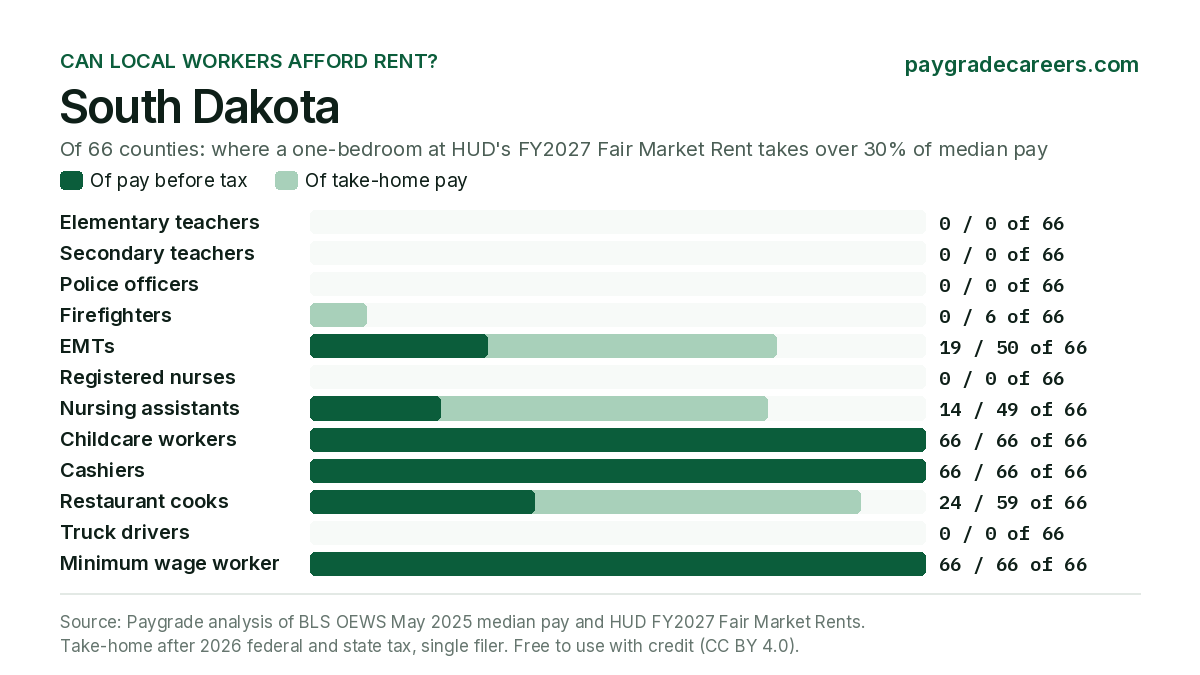
| South Dakota | 66 | 0 of 66 | Lincoln County and 3 more 25.0% | 0 of 66 | Buffalo County 21.7% |
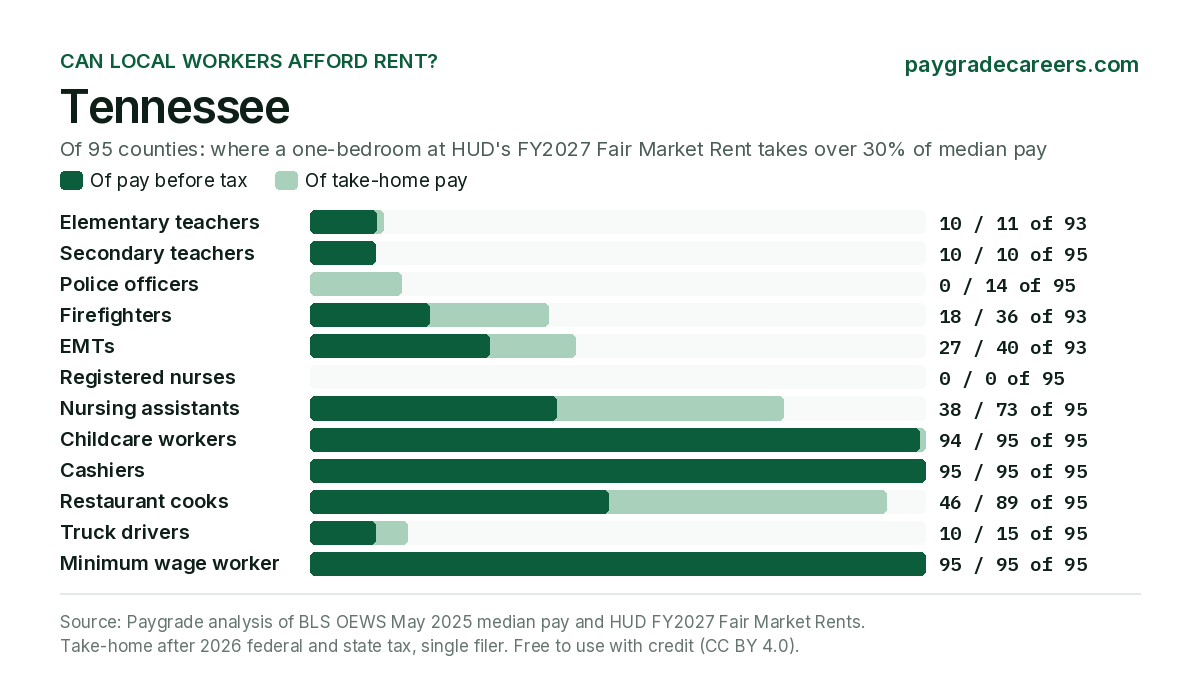
| Tennessee | 95 | 10 of 93 | Cannon County and 9 more 32.2% | 0 of 95 | Cannon County and 9 more 28.8% |
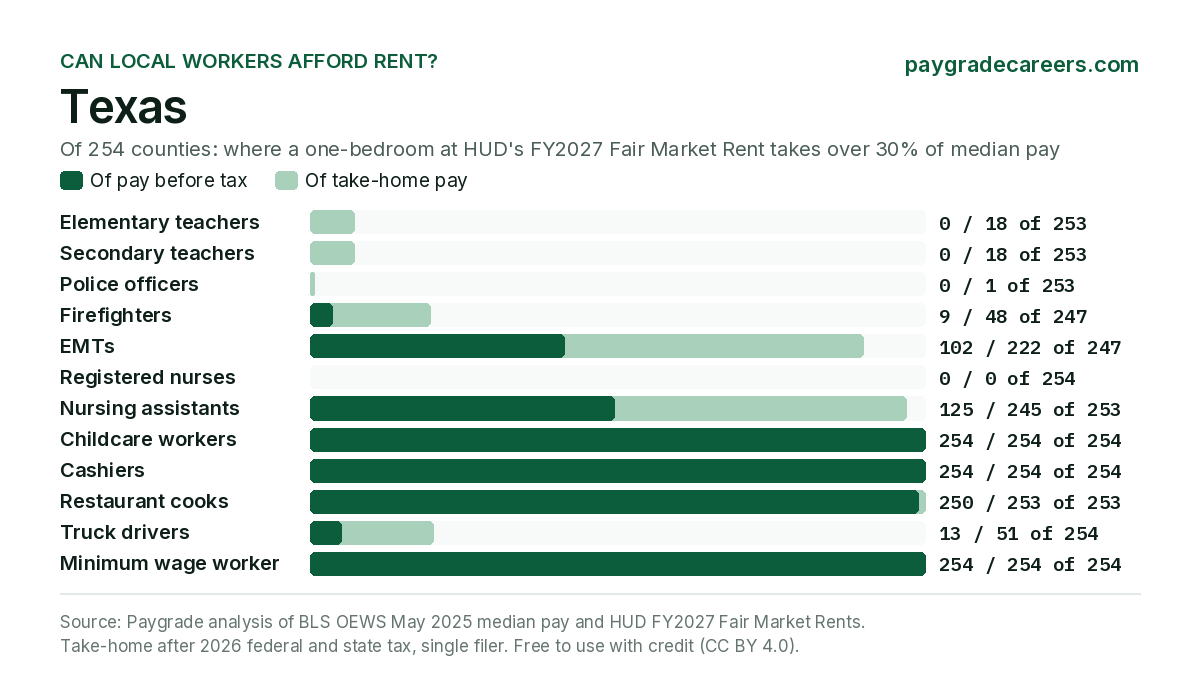
| Texas | 254 | 0 of 253 | Bastrop County and 4 more 30.0% | 0 of 253 | Hood County 25.4% |
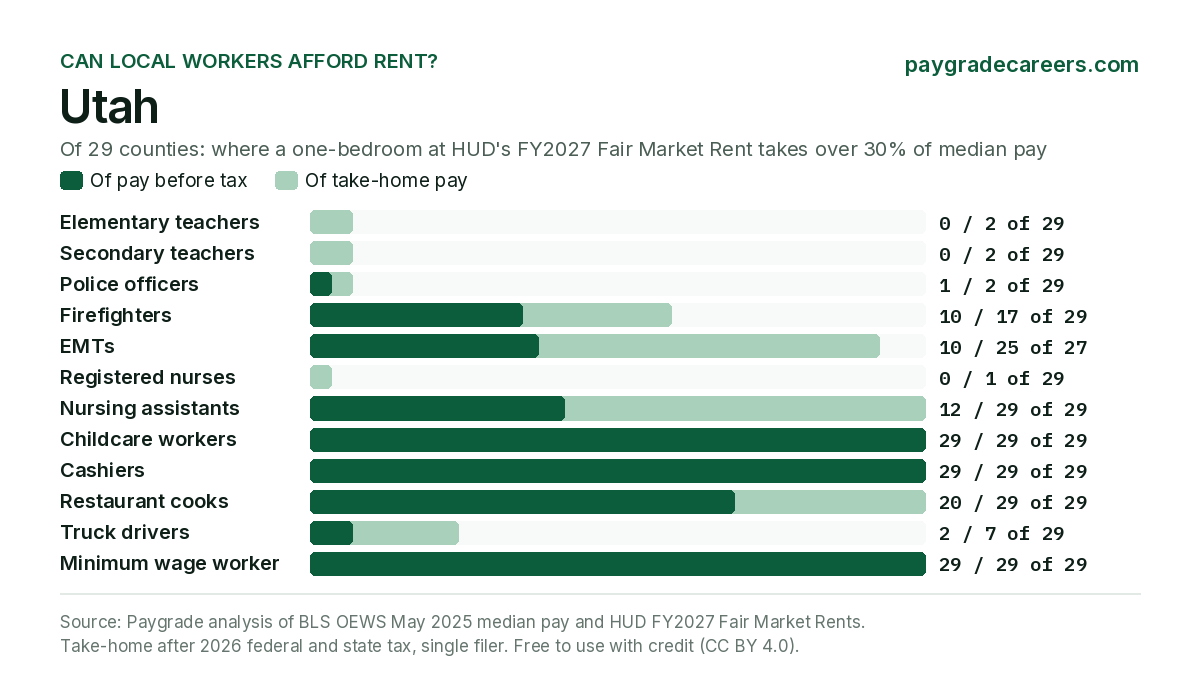
| Utah | 29 | 0 of 29 | Summit County 29.1% | 1 of 29 | Summit County 31.0% |
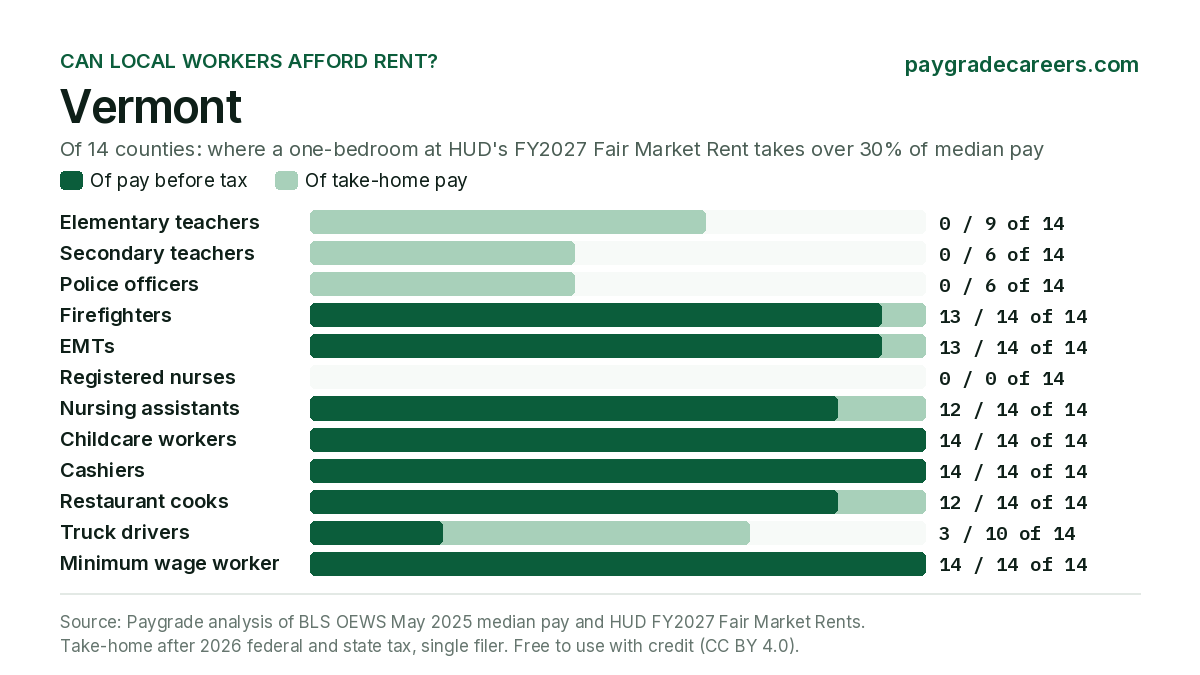
| Vermont | 14 | 0 of 14 | Chittenden County and 2 more 26.8% | 0 of 14 | Chittenden County and 2 more 27.7% |
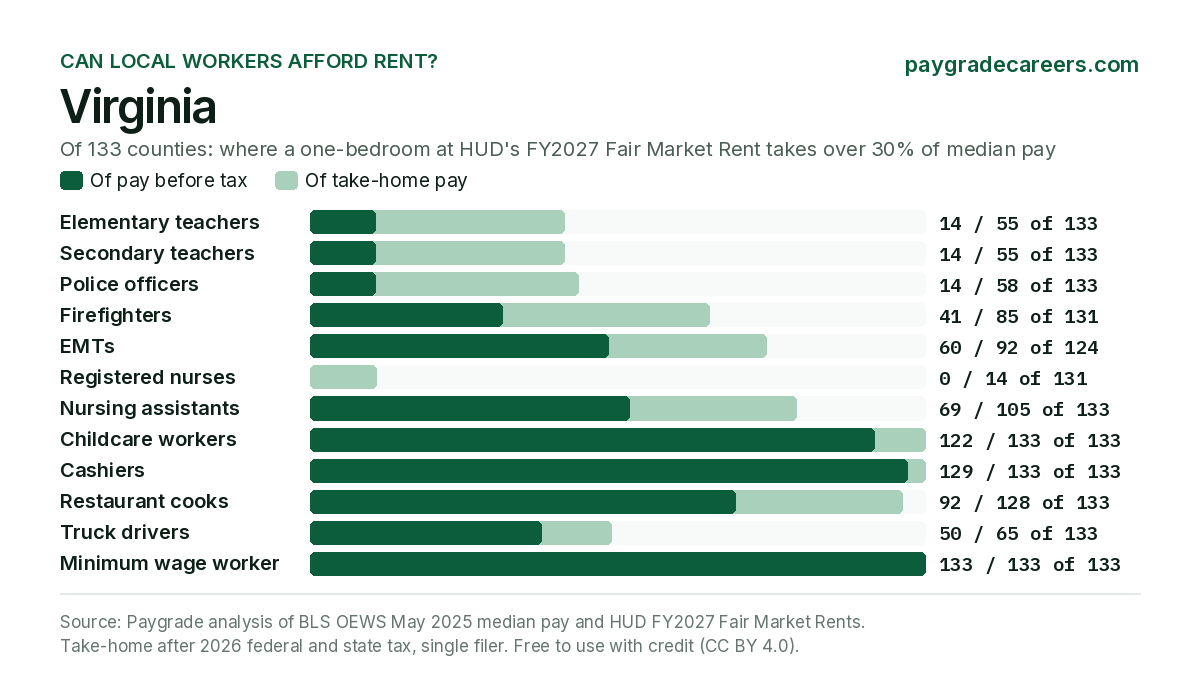
| Virginia | 133 | 14 of 133 | Alexandria city and 13 more 33.3% | 14 of 133 | Alexandria city and 13 more 31.5% |
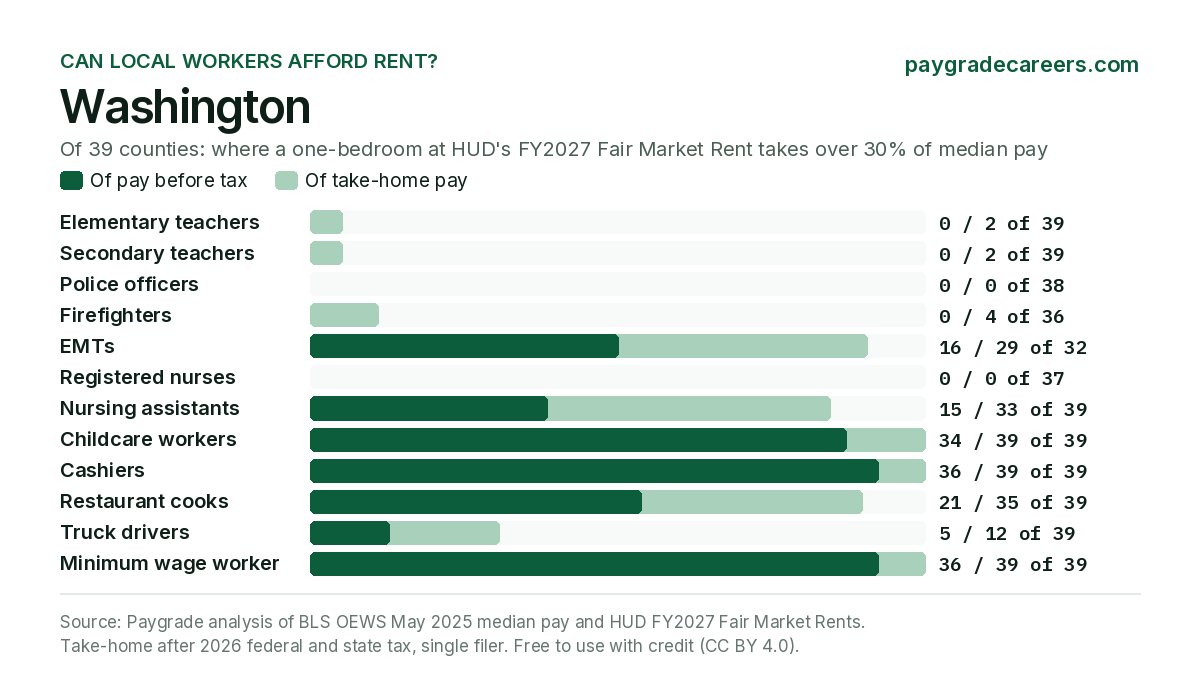
| Washington | 39 | 0 of 39 | King County and 1 more 25.4% | 0 of 38 | King County and 1 more 22.7% |
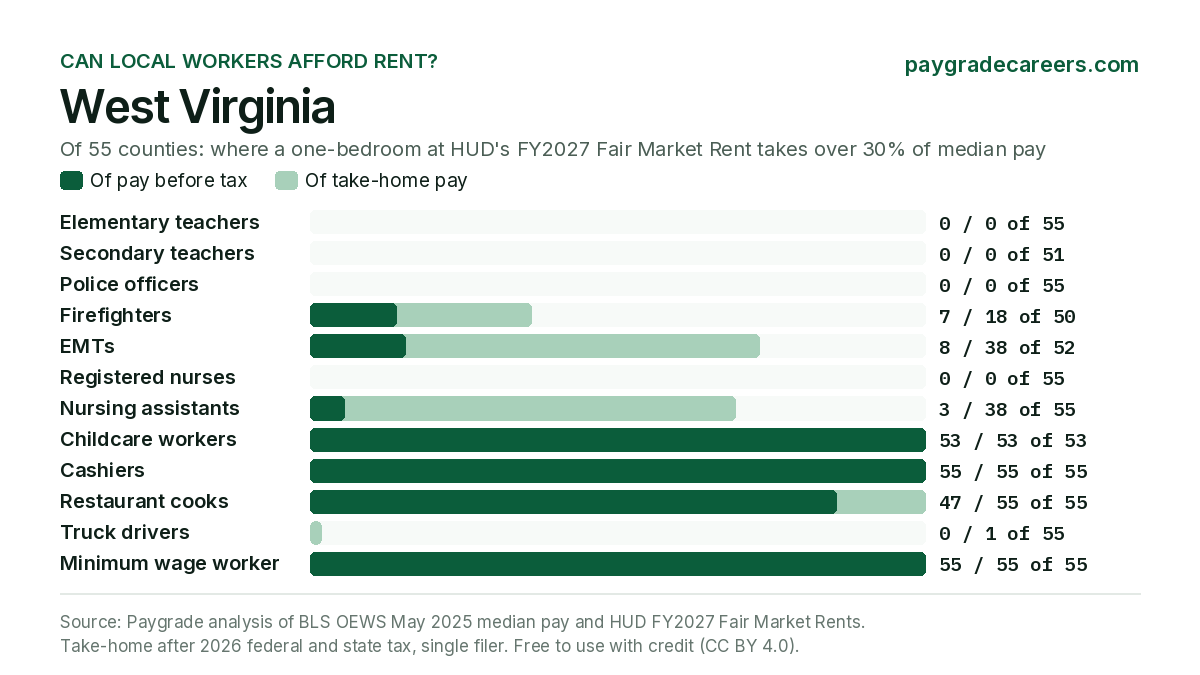
| West Virginia | 55 | 0 of 55 | Hampshire County 23.1% | 0 of 55 | Hampshire County 24.0% |
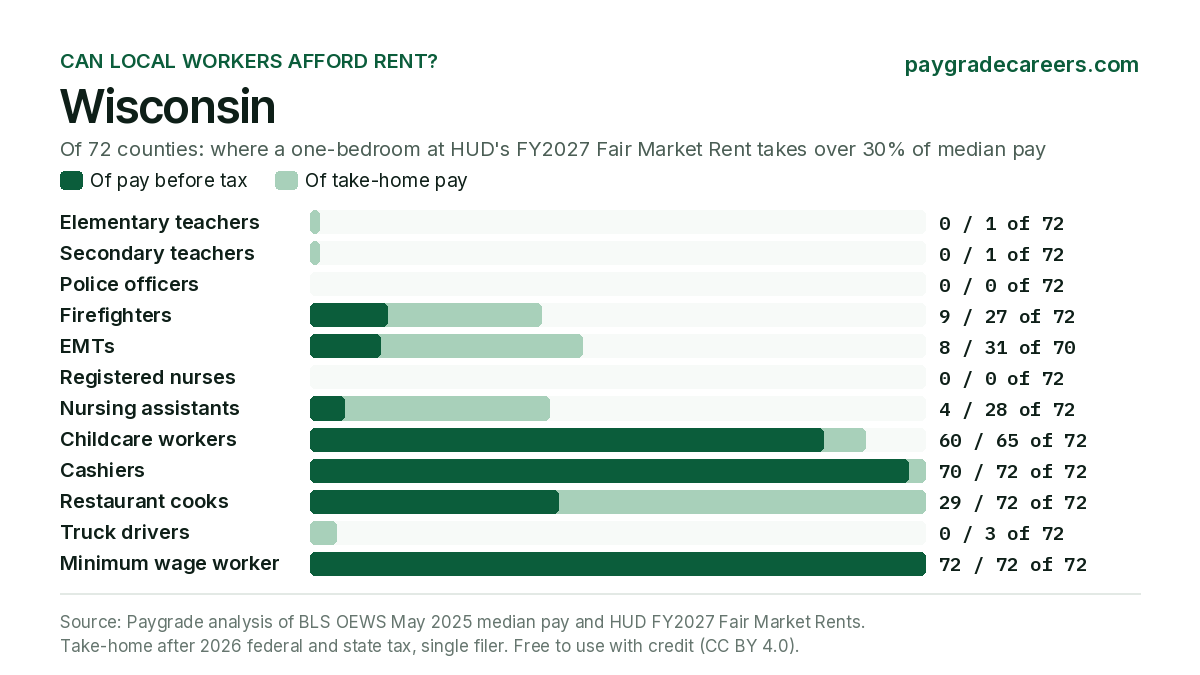
| Wisconsin | 72 | 0 of 72 | Dane County 25.9% | 0 of 72 | Dane County 20.5% |
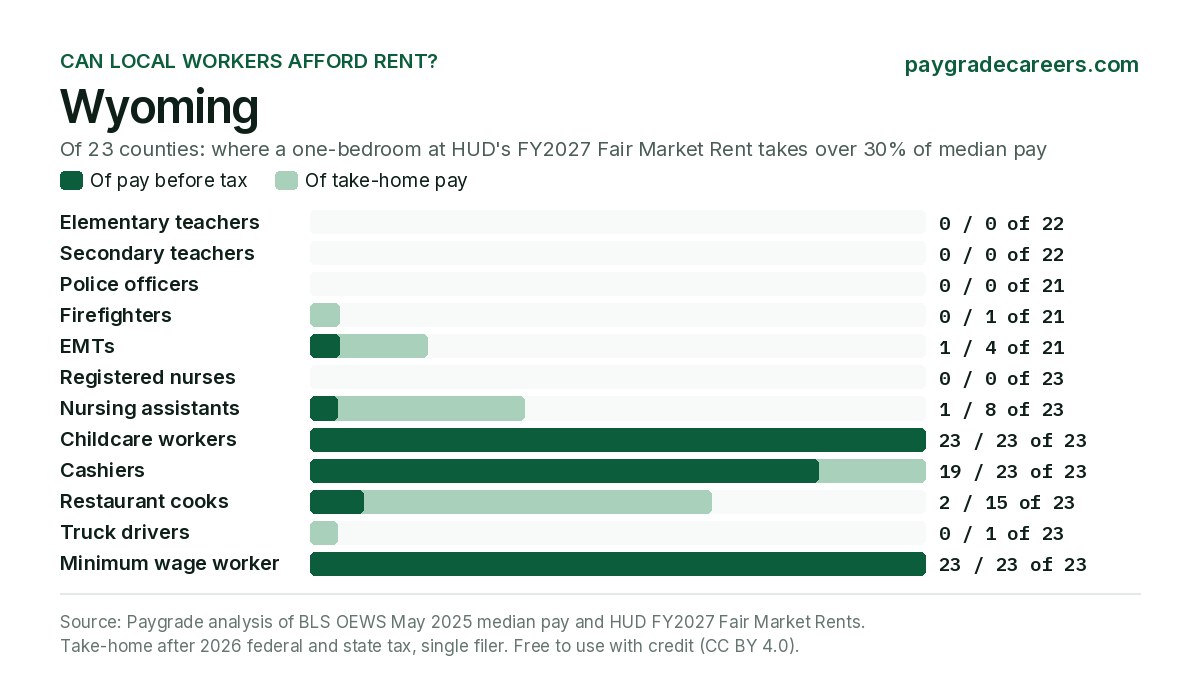
| Wyoming | 23 | 0 of 22 | Teton County 25.1% | 0 of 21 | Teton County 24.2% |
The minimum wage worker
A full-time worker (2,080 hours a year) on the state minimum wage in force on 1 January 2027, never below the federal $7.25. In 2,089 of 3,144 counties a one-bedroom at the Fair Market Rent takes more than half of that worker's gross pay. 192 counties are at or under 30%. The 68 city and county minimum wages in 9 states (Denver, Chicago, Minneapolis and Montgomery County, Maryland, among them) are left out, so this is the state floor, not every local worker's pay.
| State | Rate, 1 Jan 2027 | Counties | One-bedroom, counties over 30% | Hours a week for a one-bedroom | |||
|---|---|---|---|---|---|---|---|
| Of pay | Of take-home | Middle county | Most | Fewest | |||
| Alabama | $7.25 | 67 | 67 | 67 | 25.5 | 41.9 Baldwin County | 22.4 Clarke County |
| Alaska | $14.00 | 30 | 30 | 30 | 19.9 | 30.2 Aleutians West Census Area | 13.6 Kusilvak Census Area |
| Arizona | $15.65 | 15 | 13 | 15 | 14.2 | 22.9 Coconino County | 11.7 La Paz County |
| Arkansas | $11.00 | 75 | 75 | 75 | 15.3 | 25.0 Crittenden County | 14.6 Ashley County |
| California | $17.40 | 58 | 56 | 58 | 18.2 | 45.0 Santa Cruz County | 11.4 Modoc County |
| Colorado | $15.71 | 64 | 60 | 64 | 15.9 | 31.9 Pitkin County | 11.4 Baca County |
| Connecticut | $17.48 | 9 | 9 | 9 | 20.4 | 27.3 Greater Bridgeport Planning Region | 16.7 Northeastern Connecticut Planning Region |
| Delaware | $15.00 | 3 | 3 | 3 | 19.9 | 24.0 New Castle County | 17.6 Sussex County |
| District of Columbia | $18.40 | 1 | 1 | 1 | 27.6 | 27.6 District of Columbia | 27.6 District of Columbia |
| Florida | $15.00 | 67 | 65 | 67 | 19.4 | 32.6 Miami-Dade County | 11.3 Jackson County |
| Georgia | $7.25 | 159 | 159 | 159 | 29.0 | 51.5 Barrow County | 24.4 Atkinson County |
| Hawaii | $16.00 | 5 | 5 | 5 | 25.6 | 29.3 Maui County | 23.2 Kauai County |
| Idaho | $7.25 | 44 | 44 | 44 | 30.1 | 41.2 Ada County | 24.7 Bingham County |
| Illinois | $15.00 | 102 | 49 | 102 | 11.9 | 27.5 Kendall County | 10.9 Edwards County |
| Indiana | $7.25 | 92 | 92 | 92 | 27.8 | 42.5 Boone County | 24.7 Blackford County |
| Iowa | $7.25 | 99 | 99 | 99 | 24.4 | 38.8 Harrison County | 22.6 Appanoose County |
| Kansas | $7.25 | 105 | 105 | 105 | 24.6 | 43.5 Johnson County | 23.4 Anderson County |
| Kentucky | $7.25 | 120 | 120 | 120 | 25.4 | 38.4 Bourbon County | 22.1 Bath County |
| Louisiana | $7.25 | 64 | 64 | 64 | 26.1 | 39.1 Jefferson Parish | 21.7 Bienville Parish |
| Maine | $15.70 | 16 | 16 | 16 | 17.1 | 26.7 Cumberland County | 13.2 Aroostook County |
| Maryland | $15.00 | 24 | 24 | 24 | 25.0 | 33.9 Charles County | 13.5 Garrett County |
| Massachusetts | $15.00 | 14 | 14 | 14 | 27.1 | 42.1 Nantucket County | 20.5 Berkshire County |
| Michigan | $15.00 | 83 | 71 | 83 | 13.5 | 23.1 Washtenaw County | 11.9 Alpena County |
| Minnesota | $11.87 | 87 | 87 | 87 | 16.4 | 27.7 Anoka County | 15.1 Cass County |
| Mississippi | $7.25 | 82 | 82 | 82 | 25.6 | 37.9 DeSoto County | 22.0 Attala County |
| Missouri | $15.00 | 115 | 54 | 115 | 11.9 | 21.0 Caldwell County | 11.3 Atchison County |
| Montana | $11.20 | 56 | 56 | 56 | 22.2 | 33.2 Broadwater County | 16.6 Powder River County |
| Nebraska | $15.26 | 93 | 46 | 93 | 11.9 | 18.4 Cass County | 11.7 Arthur County |
| Nevada | $12.00 | 17 | 17 | 17 | 19.7 | 28.1 Storey County | 16.4 Pershing County |
| New Hampshire | $7.25 | 10 | 10 | 10 | 41.9 | 55.9 Rockingham County | 30.1 Coos County |
| New Jersey | $16.48 | 21 | 21 | 21 | 25.9 | 35.2 Hudson County | 19.9 Cumberland County |
| New Mexico | $12.00 | 33 | 33 | 33 | 16.9 | 27.6 Los Alamos County | 14.9 Guadalupe County |
| New York | $16.00 to $17.00 | 62 | 56 | 62 | 15.9 | 39.4 Putnam County | 11.2 Allegany County |
| North Carolina | $7.25 | 100 | 100 | 100 | 30.6 | 54.6 Buncombe County | 24.6 Ashe County |
| North Dakota | $7.25 | 53 | 53 | 53 | 27.0 | 46.5 Divide County | 24.7 Grant County |
| Ohio | $11.40 | 88 | 88 | 88 | 17.2 | 27.2 Delaware County | 15.5 Guernsey County |
| Oklahoma | $7.25 | 77 | 77 | 77 | 23.8 | 33.1 Canadian County | 22.3 Adair County |
| Oregon | $14.55 to $16.80 | 36 | 36 | 36 | 15.2 | 24.2 Columbia County | 12.3 Gilliam County |
| Pennsylvania | $7.25 | 67 | 67 | 67 | 30.0 | 49.6 Bucks County | 24.7 Cameron County |
| Rhode Island | $17.00 | 5 | 5 | 5 | 20.5 | 24.4 Newport County | 20.1 Washington County |
| South Carolina | $7.25 | 46 | 46 | 46 | 28.0 | 58.7 Beaufort County | 21.5 Chesterfield County |
| South Dakota | $12.30 | 66 | 66 | 66 | 15.7 | 20.5 Pennington County | 14.5 Brown County |
| Tennessee | $7.25 | 95 | 95 | 95 | 27.4 | 52.5 Cannon County | 24.2 Campbell County |
| Texas | $7.25 | 254 | 254 | 254 | 28.7 | 48.9 Collin County | 24.7 Cass County |
| Utah | $7.25 | 29 | 29 | 29 | 30.1 | 60.4 Summit County | 25.4 San Juan County |
| Vermont | $14.91 | 14 | 14 | 14 | 20.4 | 26.6 Chittenden County | 16.6 Essex County |
| Virginia | $13.75 | 133 | 133 | 133 | 17.6 | 37.0 Alexandria city | 12.1 Charlotte County |
| Washington | $17.73 | 39 | 36 | 39 | 14.6 | 28.4 King County | 10.5 Ferry County |
| West Virginia | $8.75 | 55 | 55 | 55 | 21.0 | 31.1 Hampshire County | 19.0 Boone County |
| Wisconsin | $7.25 | 72 | 72 | 72 | 26.9 | 45.4 Pierce County | 24.7 Ashland County |
| Wyoming | $7.25 | 23 | 23 | 23 | 26.1 | 41.0 Teton County | 24.3 Goshen County |
New York: $17.00 in New York City, Long Island and Westchester, $16.00 elsewhere (no rise on 1 January 2027). Oregon: $16.80 in Clackamas, Multnomah and Washington counties (the Portland metro rate, inside the urban growth boundary; the rest of those counties is at $15.55), $15.55 in the standard counties and $14.55 in the non-urban counties. Alaska ($14.00) and DC ($18.40) rise on 1 July 2027, so their current rates are used. Lower rates for small employers, young and tipped workers are left out. Rates from our minimum wage by state page (as of 31 October 2026). Hours a week: the Fair Market Rent x 12, divided by the rate and 52 weeks.
Small counties with high rents
1,140 counties outside metro areas have fewer than 20,000 residents. Each has its own HUD rent but shares the pay of a wide BLS nonmetropolitan area, so a small county with high rents stands out: Pitkin County, CO (16,985 people) takes the Northwest Colorado nonmetropolitan area's teacher median of $62,590 against its own $2,169 one-bedroom, 41.6% of gross pay. The county's own teachers may be paid more or less than the area's median. For police officers, 2 of 1,140 ranked small nonmetro counties are over 30%; for childcare workers, 1,017 of 1,123.
How we did it
- Counties. Every county of the 50 states and DC in BLS's May 2025 area definitions: 3,144, with Connecticut's 9 planning regions as its counties. Puerto Rico's municipios are left out, because the site has no tax or minimum wage engine for Puerto Rico.
- Pay. The BLS Occupational Employment and Wage Statistics (OEWS) median for May 2025 in the county's pay area: one of BLS's metro areas or nonmetropolitan areas, so every county in an area shares the figure. All industries, public and private employers together. Nothing is filled in where BLS publishes no median or suppresses it. Jobs: elementary and secondary school teachers, police and sheriff's patrol officers, firefighters, emergency medical technicians, registered nurses, nursing assistants, childcare workers, cashiers, restaurant cooks and heavy and tractor-trailer truck drivers (SOC 2018 codes in the CSV).
- The minimum wage worker. The state minimum wage in force on 1 January 2027 x 2,080 hours, never below the federal $7.25; New York's and Oregon's regional rates by county.
- Rent. HUD's FY2027 Fair Market Rent for a one-bedroom and a two-bedroom home, in force from 1 October 2026 to 30 September 2027. Outside New England every county has its own HUD row (3,076 counties). In New England HUD sets rents town by town: where every town in a county has the same rent the county takes it (54 counties); where they differ, we use the 2024 population-weighted average of the towns, rounded to the dollar (14 counties, marked in the finder and the CSV).
- Take-home. The same engine as every Paygrade US salary page, with 2026 rules: federal income tax for a single filer with the standard deduction, Social Security, Medicare, the state's income tax and the payroll levies it charges employees (paid leave, disability, unemployment).
- The shares. Rent share = the Fair Market Rent x 12, divided by the median pay (or take-home), as a percentage. Over 30% is HUD's rent burden line. Hours a week = the rent x 12, divided by the median hourly wage and 52 weeks: for the hourly jobs, whose yearly median is the hourly median x 2,080, it is the gross share x 40, a second way to say the same thing.
- Reliability. A county's figure for a job is marked "check" when BLS counts fewer than 100 jobs in the pay area or publishes no employment, or when the relative standard error of its mean wage is above 10% or not published: 947 county and job figures, mostly firefighters and EMTs in nonmetro areas. They are shown and counted, but never ranked.
What it can't tell you
- A Fair Market Rent is not what tenants pay. It is HUD's estimate of the 40th percentile gross rent (rent plus the utilities the tenant pays) of standard-quality rental homes in the area, set for the Housing Choice Voucher programme. Real rents for a given home can be higher or lower, and in metro areas one Fair Market Rent covers a whole HUD area.
- OEWS pays by area, not by county. Counties in one BLS pay area share the pay figure and differ only by rent, and pay is by place of work. 308 counties sit in a metro area that crosses a state line: their pay is the whole metro's, while tax is the county's own state's.
- The median is not starting pay. Half of workers in the job earn less than the median, and new hires usually do. For the hourly jobs BLS's yearly figure assumes full-time hours, so anyone working fewer hours earns less and pays a larger share. OEWS counts part-time and full-time employees, and leaves out overtime.
- One earner, no other income. A single filer with the standard deduction and no dependants. Two-earner households, children and credits change the picture.
- Local income taxes and refundable credits are left out. Cities, counties or school districts tax pay in parts of AL, CO, DE, IA, IN, KY, MD, MI, MO, NY, OH, OR, PA and WV, so take-home there is a little lower than shown. The federal earned income tax credit and other refundable credits are not counted either, so take-home for the lowest-paid is a little higher than shown.
- New England counties are town-weighted where towns differ. In 14 counties the rent is an average of towns with different Fair Market Rents, so a given town can be higher or lower.
- Different dates. Pay is BLS's May 2025 estimate (released 15 May 2026); the rents run from 1 October 2026; tax is 2026; the minimum wage is the rate on 1 January 2027 (our data as of 31 October 2026). Pay may have changed since May 2025: the study does not estimate by how much.
- Some small-area figures are low or noisy. A few firefighter medians are low (the lowest ranked is $22,800, in the Monroe, LA metro area): OEWS counts part-time as well as full-time employees on payroll. Check them with the local department before using them.
Sources
- U.S. Department of Housing and Urban Development, Fair Market Rents, FY2027, county level file (downloaded 21 November 2026), and the notice Fair Market Rents for Fiscal Year 2027 (Federal Register document 2026-17891, published 1 September 2026, effective 1 October 2026). The county populations are HUD's 2024 figures in the same file.
- U.S. Bureau of Labor Statistics, Occupational Employment and Wage Statistics, May 2025 metropolitan and nonmetropolitan area estimates and area definitions, released 15 May 2026.
- State minimum wages on 1 January 2027: each state's official rates, collected with their sources on our minimum wage by state page (as of 31 October 2026).
- Tax rules for 2026: the IRS (Revenue Procedure 2025-32, Publication 15) and each state's revenue department, listed state by state in our paycheck calculator. How Paygrade works out every figure: methodology.
Use these charts
The national chart and a card for every state and DC are free to use in your own article or broadcast, with credit (CC BY 4.0): download the image, or copy the snippet, which carries the credit and a link to this page.
Download the national chart (PNG)
Every state's card
- Alabama
- Alaska
- Arizona
- Arkansas
- California
- Colorado
- Connecticut
- Delaware
- District of Columbia
- Florida
- Georgia
- Hawaii
- Idaho
- Illinois
- Indiana
- Iowa
- Kansas
- Kentucky
- Louisiana
- Maine
- Maryland
- Massachusetts
- Michigan
- Minnesota
- Mississippi
- Missouri
- Montana
- Nebraska
- Nevada
- New Hampshire
- New Jersey
- New Mexico
- New York
- North Carolina
- North Dakota
- Ohio
- Oklahoma
- Oregon
- Pennsylvania
- Rhode Island
- South Carolina
- South Dakota
- Tennessee
- Texas
- Utah
- Vermont
- Virginia
- Washington
- West Virginia
- Wisconsin
- Wyoming
Download the data and cite it
Free to reuse under CC BY 4.0. The BLS and HUD inputs are US federal government data. Please credit "Source: Paygrade analysis of BLS OEWS (May 2025) and HUD FY2027 Fair Market Rents, paygradecareers.com" and link to this page. A short line for a chart: "BLS (May 2025) and HUD (FY2027 rents)".
One row for every county and job: 37,728 rows (3,144 counties x 12 jobs), including the figures we don't rank. Each state's rows are also a download of their own in the finder above. Columns:
- state, state_name, county, fips
- From BLS's May 2025 area definitions (5-digit county FIPS; Connecticut's 9 planning regions)
- population_2024_hud
- HUD's 2024 population for the county (the sum of its towns in New England)
- oews_area_code, oews_area_title, oews_area_type
- The county's BLS pay area: a metro area or a nonmetropolitan area
- hud_fmr_area_code, hud_fmr_area_name
- HUD's FMR area (several where a New England county's towns sit in more than one)
- fmr_method, new_england_towns
- county (HUD's county row), towns-identical or town-weighted (New England, see the method), and the number of towns
- job_code, job, pay_basis
- SOC 2018 code, or MW-2027 for the full-time minimum wage worker
- median_annual, median_hourly
- BLS OEWS May 2025 medians for the pay area; for MW-2027 the state rate x 2,080 and the rate
- pay_note
- Why a figure is missing (not published, suppressed), teachers' annual-only pay, or the minimum wage rule used
- area_employment, wage_rse_pct
- BLS's employment of the job in the area and the relative standard error of its mean wage, %
- reliability
- ok, or check with the reason (under 100 jobs or employment not published, or a wage error above 10%)
- take_home_annual
- Median pay after federal and state income tax, Social Security, Medicare and state payroll levies (2026, single filer)
- fmr_1br, fmr_2br
- HUD FY2027 Fair Market Rent, dollars a month
- rent_share_gross_*_pct, rent_share_takehome_*_pct
- A year of rent as a percentage of median pay or take-home, 2 decimals
- hours_week_1br, hours_week_2br
- Hours of work a week at the median hourly wage to pay the rent (blank for teachers)
- over30_*
- yes when the share is above 30%
Journalists: email hello@paygradecareers.com for your county's figures, another job, or a question on the method.
Related
- Where pay goes furthest: every job BLS publishes, in every state and metro area, after tax and living costs
- The minimum wage by state and the paycheck calculator: take-home pay in any state
- Pay in the US for teachers, police officers, firefighters, registered nurses and nursing assistants, by state and city
- Renters' own wages, county by county: the National Low Income Housing Coalition's Out of Reach
- Salaries in the United States, more Paygrade studies and open data