Paygrade study · Gibraltar · Employment Survey 2025
Is Gibraltar pay keeping up with prices?
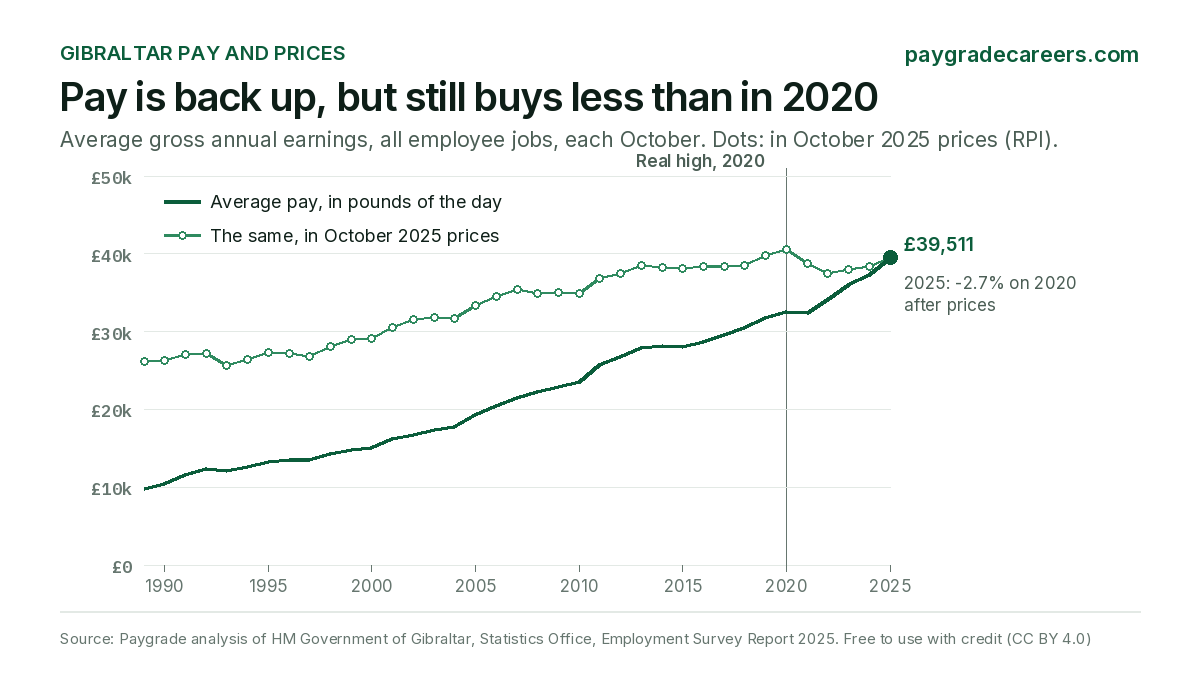
Average pay in Gibraltar rose 5.8% to £39,510.90 in October 2025, the biggest rise since 2011 and twice the 2.9% rise in prices. But after the price jump of 2021 and 2022 it still buys 2.7% less than in October 2020, its highest point, and 0.6% less than in 2019. The typical job pays well under the average: just over half of all jobs pay less than £30,000 a year.
By Dominic Roworth · Published 17 November 2026 · Data: HM Government of Gibraltar, Statistics Office, Employment Survey Reports 2012 to 2025 (the 2025 report was published in June 2026)
What the data shows
- Pay is rising faster than prices again. Average gross annual earnings across all 32,206 employee jobs rose from £37,332.42 to £39,510.90 in the year to October 2025. The Index of Retail Prices rose 2.9%, so pay gained 2.8% in real terms, the third year in a row ahead of prices.
- It hasn't made up for 2021 and 2022. Pay fell 4.7% behind prices in 2021 and 3.2% in 2022. In October 2025 prices, the 2020 average was worth £40,606; today's is £39,511. Since 2020, pay is up 21.1% and prices 24.5%.
- Over 13 years, pay has only just beaten prices. Since October 2012, average pay rose 47.7% and prices 39.9%: a real gain of 5.6% in all, well under half a percent a year. Since 1989 the real gain is 51.3%.
- The typical job pays far less than the average. The middle job pays £28,000 to £29,999 a year (£32,000 to £33,999 for full-time jobs), against the £39,511 average. 68.9% of jobs pay less than £40,000, while 14.7% pay £60,000 or more and pull the average up.
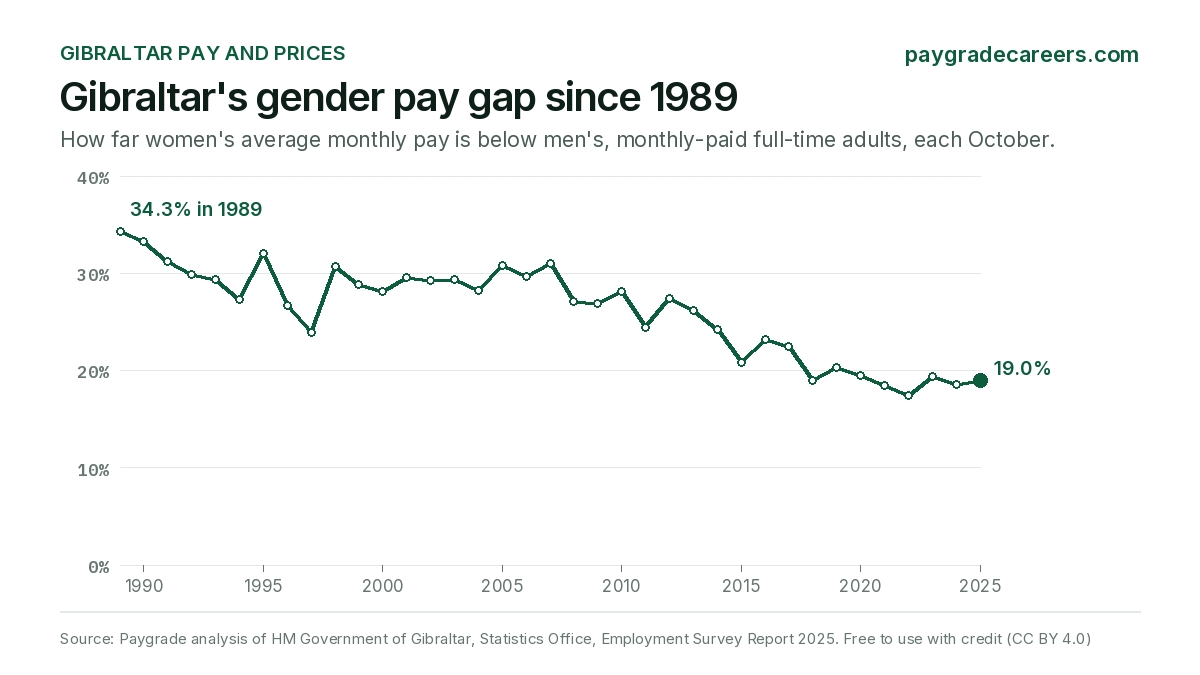
- The gender pay gap has narrowed by almost half since 1989. Among monthly-paid full-time adults, women's average pay is 19.0% below men's (£3,344.85 against £4,130.81 a month), down from 27.4% in 2012 and 34.3% in 1989. It is wider in the public sector (28.7%) than in private firms (18.5%), and widest in finance (39.6%).
- Almost half of all jobs are now held by frontier workers. Employee jobs grew 49.7% from 21,519 to 32,206 between 2012 and 2025, and frontier worker jobs more than doubled, from 6,425 to 14,112: 43.8% of all jobs, up from 29.9%.
Pay against prices since 1989
The line in pounds of the day climbs almost every year. The line in October 2025 prices shows what each year's average would buy today. It rose to a high in 2020, fell for two years as prices jumped, and is still below its 2020 and 2019 levels.
Average pay, and what it buys in today's prices
Average gross annual earnings, all employee jobs, each October. October 2025 prices use Gibraltar's Index of Retail Prices.
- Average pay: £39,511
- In October 2025 prices: £39,511
Average pay: 1989 £9,798; 1990 £10,505; 1991 £11,695; 1992 £12,421; 1993 £12,138; 1994 £12,691; 1995 £13,303; 1996 £13,517; 1997 £13,525; 1998 £14,395; 1999 £14,875; 2000 £15,165; 2001 £16,199; 2002 £16,803; 2003 £17,460; 2004 £17,834; 2005 £19,384; 2006 £20,471; 2007 £21,586; 2008 £22,266; 2009 £22,928; 2010 £23,576; 2011 £25,831; 2012 £26,747; 2013 £27,987; 2014 £28,244; 2015 £28,091; 2016 £28,752; 2017 £29,575; 2018 £30,497; 2019 £31,764; 2020 £32,625; 2021 £32,443; 2022 £34,105; 2023 £36,050; 2024 £37,332; 2025 £39,511. In October 2025 prices: 1989 £26,121; 1990 £26,298; 1991 £27,113; 1992 £27,187; 1993 £25,581; 1994 £26,474; 1995 £27,281; 1996 £27,238; 1997 £26,788; 1998 £28,115; 1999 £29,010; 2000 £29,169; 2001 £30,478; 2002 £31,503; 2003 £31,774; 2004 £31,719; 2005 £33,405; 2006 £34,475; 2007 £35,371; 2008 £34,919; 2009 £34,970; 2010 £34,957; 2011 £36,886; 2012 £37,413; 2013 £38,440; 2014 £38,262; 2015 £38,054; 2016 £38,345; 2017 £38,425; 2018 £38,515; 2019 £39,738; 2020 £40,606; 2021 £38,717; 2022 £37,495; 2023 £38,003; 2024 £38,428; 2025 £39,511.
Every October, 1989 to 2025
| October | Average pay | Change | Prices (RPI) | Price change | In October 2025 prices | Real change |
|---|---|---|---|---|---|---|
| 2025 | £39,510.90 | +5.8% | 266.6 | +2.9% | £39,511 | +2.8% |
| 2024 | £37,332.42 | +3.6% | 259.0 | +2.4% | £38,428 | +1.1% |
| 2023 | £36,050.21 | +5.7% | 252.9 | +4.3% | £38,003 | +1.4% |
| 2022 | £34,105.45 | +5.1% | 242.5 | +8.5% | £37,495 | -3.2% |
| 2021 | £32,443.47 | -0.6% | 223.4 | +4.3% | £38,717 | -4.7% |
| 2020 | £32,625.26 | +2.7% | 214.2 | +0.5% | £40,606 | +2.2% |
| 2019 | £31,763.69 | +4.2% | 213.1 | +0.9% | £39,738 | +3.2% |
| 2018 | £30,496.79 | +3.1% | 211.1 | +2.9% | £38,515 | +0.2% |
| 2017 | £29,575.20 | +2.9% | 205.2 | +2.7% | £38,425 | +0.2% |
| 2016 | £28,751.62 | +2.4% | 199.9 | +1.6% | £38,345 | +0.8% |
| 2015 | £28,090.78 | -0.5% | 196.8 | 0.0% | £38,054 | -0.5% |
| 2014 | £28,244.13 | +0.9% | 196.8 | +1.4% | £38,262 | -0.5% |
| 2013 | £27,986.64 | +4.6% | 194.1 | +1.8% | £38,440 | +2.7% |
| 2012 | £26,747.34 | +3.5% | 190.6 | +2.1% | £37,413 | +1.4% |
| 2011 | £25,831.19 | +9.6% | 186.7 | +3.8% | £36,886 | +5.5% |
| 2010 | £23,575.59 | +2.8% | 179.8 | +2.9% | £34,957 | 0.0% |
| 2009 | £22,928.25 | +3.0% | 174.8 | +2.8% | £34,970 | +0.1% |
| 2008 | £22,266.30 | +3.2% | 170.0 | +4.5% | £34,919 | -1.3% |
| 2007 | £21,585.91 | +5.4% | 162.7 | +2.8% | £35,371 | +2.6% |
| 2006 | £20,470.57 | +5.6% | 158.3 | +2.3% | £34,475 | +3.2% |
| 2005 | £19,383.80 | +8.7% | 154.7 | +3.2% | £33,405 | +5.3% |
| 2004 | £17,834.25 | +2.1% | 149.9 | +2.3% | £31,719 | -0.2% |
| 2003 | £17,460.44 | +3.9% | 146.5 | +3.0% | £31,774 | +0.9% |
| 2002 | £16,802.96 | +3.7% | 142.2 | +0.4% | £31,503 | +3.4% |
| 2001 | £16,199.42 | +6.8% | 141.7 | +2.2% | £30,478 | +4.5% |
| 2000 | £15,164.52 | +1.9% | 138.6 | +1.4% | £29,169 | +0.5% |
| 1999 | £14,874.91 | +3.3% | 136.7 | +0.1% | £29,010 | +3.2% |
| 1998 | £14,394.72 | +6.4% | 136.5 | +1.4% | £28,115 | +5.0% |
| 1997 | £13,524.87 | +0.1% | 134.6 | +1.7% | £26,788 | -1.6% |
| 1996 | £13,516.60 | +1.6% | 132.3 | +1.8% | £27,238 | -0.2% |
| 1995 | £13,302.94 | +4.8% | 130.0 | +1.7% | £27,281 | +3.1% |
| 1994 | £12,690.69 | +4.6% | 127.8 | +1.0% | £26,474 | +3.5% |
| 1993 | £12,138.22 | -2.3% | 126.5 | +3.9% | £25,581 | -5.9% |
| 1992 | £12,420.62 | +6.2% | 121.8 | +5.9% | £27,187 | +0.3% |
| 1991 | £11,695.37 | +11.3% | 115.0 | +8.0% | £27,113 | +3.1% |
| 1990 | £10,505.23 | +7.2% | 106.5 | +6.5% | £26,298 | +0.7% |
| 1989 | £9,797.68 | 100.0 | £26,121 |
Since 2012, pay fell behind prices in 4 years: 2014, 2015, 2021 and 2022. The 2020 figure needs a word of caution. The October 2020 survey counted 1,087 fewer jobs than 2019, with the biggest falls in construction and in hotels and restaurants, two of the lower-paying industries. An average rises when lower-paid jobs drop out even if nobody's pay changes. That is why we also compare with 2019, before the pandemic: today's average still buys 0.6% less (£39,738 in October 2025 prices then, against £39,511 now).
What the typical job pays
The £39,511 headline is an average, and the best-paid jobs pull it up: 14.7% of jobs pay £60,000 or more. The Statistics Office also counts jobs by annual pay band. Counting up from the lowest band, the middle job falls in the £28,000 to £29,999 band. For full-time jobs, whose average is £43,276, the middle job is in the £32,000 to £33,999 band.
| Annual pay, October 2025 | All jobs | Share | Full-time jobs | Share |
|---|---|---|---|---|
| Under £20,000 | 8,702 | 27.0% | 5,097 | 18.5% |
| £20,000 to £29,999 | 7,781 | 24.2% | 7,189 | 26.1% |
| £30,000 to £39,999 | 5,720 | 17.8% | 5,464 | 19.8% |
| £40,000 to £59,999 | 5,265 | 16.3% | 5,109 | 18.6% |
| £60,000 and over | 4,738 | 14.7% | 4,671 | 17.0% |
| All | 32,206 | 100% | 27,530 | 100% |
Employment Survey Report 2025, Table 13.3 (jobs by band of average annual earnings, full-time and part-time). The groups add the report's own bands together. "Under £20,000" includes part-time jobs, which is why it is the largest group among all jobs.
The gender pay gap
The gap here is the difference between men's and women's average monthly pay, as a share of men's, for monthly-paid full-time adults (Tables 11.1, 11.2 and 3.3). It compares averages, not the same jobs: much of it comes from who does which job, and how senior they are. Among managers and senior officials, women's average is 27.9% below men's.
Gender pay gap, monthly-paid full-time adults
How far women's average monthly pay is below men's, each October.
- Gap: 19.0%
Gender pay gap: 1989 34.3%; 1990 33.3%; 1991 31.2%; 1992 29.9%; 1993 29.4%; 1994 27.3%; 1995 32.0%; 1996 26.7%; 1997 23.9%; 1998 30.7%; 1999 28.8%; 2000 28.1%; 2001 29.6%; 2002 29.3%; 2003 29.4%; 2004 28.2%; 2005 30.8%; 2006 29.7%; 2007 31.0%; 2008 27.1%; 2009 26.9%; 2010 28.1%; 2011 24.4%; 2012 27.4%; 2013 26.2%; 2014 24.2%; 2015 20.8%; 2016 23.2%; 2017 22.5%; 2018 19.0%; 2019 20.3%; 2020 19.5%; 2021 18.5%; 2022 17.4%; 2023 19.4%; 2024 18.6%; 2025 19.0%.
The gap by industry
How far women's average monthly pay is below men's. Industries with at least 100 men and 100 women. A negative figure means women earn more.
- Financial Intermediation 39.6%
- Wholesale and Retail Trade 29.1%
- Health and Social Work 27.6%
- Real Estate and Business Activities 24.1%
- Other Services 22.2%
- Transport and Communication 21.5%
- Public Administration and Defence 20.0%
- Education 18.3%
- Hotels and Restaurants 7.2%
- Construction -8.0%
| Monthly-paid full-time adults | Men | Average a month | Women | Average a month | Gap |
|---|---|---|---|---|---|
| All | 14,400 | £4,130.81 | 9,206 | £3,344.85 | 19.0% |
| Public sector | 2,389 | £5,137.75 | 2,769 | £3,663.09 | 28.7% |
| Private sector | 11,685 | £3,943.77 | 6,298 | £3,214.88 | 18.5% |
| Financial Intermediation | 958 | £6,684.46 | 1,017 | £4,039.18 | 39.6% |
| Wholesale and Retail Trade | 1,508 | £3,158.63 | 668 | £2,239.83 | 29.1% |
| Health and Social Work | 1,064 | £4,303.16 | 1,956 | £3,114.71 | 27.6% |
| Real Estate and Business Activities | 2,164 | £4,576.22 | 1,221 | £3,474.40 | 24.1% |
| Other Services | 2,531 | £5,069.17 | 1,619 | £3,942.59 | 22.2% |
| Transport and Communication | 1,040 | £3,593.86 | 285 | £2,821.45 | 21.5% |
| Public Administration and Defence | 1,333 | £4,640.13 | 768 | £3,711.00 | 20.0% |
| Education | 246 | £3,880.99 | 1,095 | £3,170.36 | 18.3% |
| Hotels and Restaurants | 434 | £2,067.44 | 319 | £1,918.52 | 7.2% |
| Construction | 2,680 | £2,451.24 | 193 | £2,646.56 | -8.0% |
| Managers and Senior Officials | 3,440 | £7,171.04 | 1,797 | £5,169.84 | 27.9% |
| Professional | 1,197 | £5,509.82 | 1,066 | £4,322.93 | 21.5% |
| Sales and Customer Service | 958 | £2,755.16 | 764 | £2,271.59 | 17.6% |
| Personal Service | 570 | £2,535.38 | 1,535 | £2,178.77 | 14.1% |
| Elementary | 1,847 | £2,045.95 | 517 | £1,811.08 | 11.5% |
| Administrative and Secretarial | 1,219 | £2,915.16 | 2,042 | £2,595.24 | 11.0% |
| Associate Professional and Technical | 2,218 | £4,040.31 | 1,390 | £3,810.75 | 5.7% |
Rows after the sectors are industries, then occupations, each with at least 100 men and 100 women. In construction, women's average is 8.0% above men's: 193 women against 2,680 men, most of them likely in office roles.
Pay in the industries small firms work in
The survey doesn't split pay by the size of the business, but most of Gibraltar's small firms are in a handful of industries. For full-time staff paid by the week, often shift and hourly work, average pay an hour in October 2025 was close to the legal floor in hospitality: women in hotels and restaurants averaged £10.07, 57p above the £9.50 minimum wage at the time and 7p above today's £10.00 (from 1 August 2026).
| Industry | Private-sector jobs | Weekly-paid men, an hour | Weekly-paid women, an hour | Monthly-paid men, a month | Monthly-paid women, a month |
|---|---|---|---|---|---|
| Hotels and Restaurants | 2,129 | £10.82 | £10.07 | £2,067.44 | £1,918.52 |
| Wholesale and Retail Trade | 3,591 | £11.81 | £11.02 | £3,158.63 | £2,239.83 |
| Business services (real estate and business activities) | 4,390 | £12.09 | £10.90 | £4,576.22 | £3,474.40 |
| Construction | 3,640 | £12.93 | £14.31 (25 jobs) | £2,451.24 | £2,646.56 |
Employment Survey Report 2025: an hour is average weekly earnings divided by average weekly hours for full-time adults paid by the week, overtime included (Tables 3.1 and 3.2); a month is the average for full-time adults paid by the month (Table 3.3); private-sector jobs from Table 8.1 (25,261 in all). Minimum wage: the Conditions of Employment (Standard Minimum Wage) Order, £9.50 from 1 August 2025 and £10.00 from 1 August 2026. More on the Gibraltar minimum wage.
Where the jobs came from
Gibraltar had 32,206 employee jobs in October 2025, 10,687 more than in 2012. Real Estate and Business Activities (2,451 to 4,548), Health and Social Work (1,871 to 3,787), Construction (2,008 to 3,884) added the most. Frontier workers, who live outside Gibraltar and cross the border to work, held 14,112 of the jobs, up from 6,425. More on who they are and the rules they work under: frontier workers in Gibraltar.
| Industry | October 2012 | October 2025 | Change |
|---|---|---|---|
| Real Estate and Business Activities | 2,451 | 4,548 | +85.6% |
| Health and Social Work | 1,871 | 3,787 | +102.4% |
| Construction | 2,008 | 3,884 | +93.4% |
| Other Services | 3,783 | 4,990 | +31.9% |
| Hotels and Restaurants | 1,218 | 2,129 | +74.8% |
| Education | 944 | 1,771 | +87.6% |
| Transport and Communication | 1,302 | 1,903 | +46.2% |
| Wholesale and Retail Trade | 3,123 | 3,591 | +15.0% |
| Public Administration and Defence | 2,075 | 2,424 | +16.8% |
| Financial Intermediation | 2,003 | 2,289 | +14.3% |
| Shipbuilding | 243 | 407 | +67.5% |
| Other Manufacture | 200 | 199 | -0.5% |
| Electricity and Water Supply | 298 | 284 | -4.7% |
| All employee jobs | 21,519 | 32,206 | +49.7% |
| Of which frontier worker jobs | 6,425 | 14,112 | +119.6% |
Employment Survey Reports 2012 and 2025, Table 1.1 (employee jobs by industry) and Table 2.4 (frontier worker jobs). For pay by industry and occupation today, see jobs in Gibraltar.
Use these charts
Both charts are free to use in your own article or broadcast, with credit (CC BY 4.0): please credit "Paygrade analysis of HM Government of Gibraltar Employment Survey data" and link to this page.
How we did it
- Pay: average gross annual earnings of all employee jobs, full-time and part-time, each October, as printed in Table 13.4 of the Employment Survey Report 2025. It is a mean (the total pay bill divided by the number of jobs), not a median, and it counts jobs, so a person with two jobs counts twice. The survey covers all employers, with a response the Statistics Office describes as almost 100%.
- Prices: Gibraltar's Index of Retail Prices in October, as printed in Table 9.7 of the same report (October 1989 = 100). Pay in October 2025 prices is each year's average multiplied by the 2025 index and divided by that year's. We use the long series from one report, because each report re-bases its indices and can revise earlier years.
- The typical job: Table 13.3 counts jobs by band of annual pay. We add the bands from the lowest until we pass half of all jobs, so we can name the band that holds the middle job, but not an exact median.
- Gender gap: (men's average minus women's) divided by men's, for monthly-paid full-time adults (Tables 11.1, 11.2 and 3.3). Weekly-paid and part-time jobs are not in it. By industry and occupation we show only groups with at least 100 men and 100 women.
- Limits: averages move when the mix of jobs changes, not only when pay does. The reports don't say whether the earnings include overtime for monthly-paid staff. The industry and occupation groups are the report's own (older UK classifications, the same in every year), and the 2012 and 2025 job counts come from each year's own report.
Download every October from 1989 to 2025 as CSV: average pay, prices, pay in today's prices, the monthly pay of full-time men and women, the gap, employee jobs and frontier worker jobs. Free to reuse under CC BY 4.0: please credit "Paygrade analysis of HM Government of Gibraltar Employment Survey data" and link to this page. Journalists: email hello@paygradecareers.com for a cut by industry, sector or year.
Sources
- HM Government of Gibraltar, Statistics Office, Employment Survey Report 2025 (survey of October 2025, published June 2026): Tables 1.1, 2.4, 3.3, 9.7, 11.1, 11.2, 13.3 and 13.4.
- HM Government of Gibraltar, Statistics Office, Employment Survey Report 2012: Tables 1.1, 2.4 and 3.3.
- HM Government of Gibraltar, Statistics Office, statistics downloads (every Employment Survey Report since 1984).
Related
- Working in Gibraltar: pay, tax, jobs and moving there
- Jobs in Gibraltar: where the jobs are and what each industry pays
- Gibraltar minimum wage
- Tax in Gibraltar: income tax and social insurance
- Frontier workers in Gibraltar
- More Paygrade studies