Paygrade study · Guernsey · States of Guernsey earnings data
Is Guernsey pay keeping up with prices?
The typical Guernsey employee earned £42,672 in the year to June 2024, the last earnings figure the States has published. After prices, that was 1.7% less than at the end of 2021. In the States' own series, real median pay in 2024 was only £1,601 a year (3.9%) higher than in 2009. Since June 2024 the island's RPI has risen a further 9.3%, with no new earnings figures to measure pay against it.
By Dominic Roworth · Published 19 November 2026 · Data: States of Guernsey, Data and Analysis: earnings bulletins (latest 29 October 2024), Facts and Figures 2026 and the Retail Prices Index (latest 27th October 2026)
What the data shows
- Real pay is below its 2021 high. Median earnings of £42,672 in the four quarters to June 2024 were 5.3% higher than a year earlier but 0.7% lower after prices, the States' own figures. Chaining its published real values, the typical employee was 1.7% worse off than in the four quarters to December 2021.
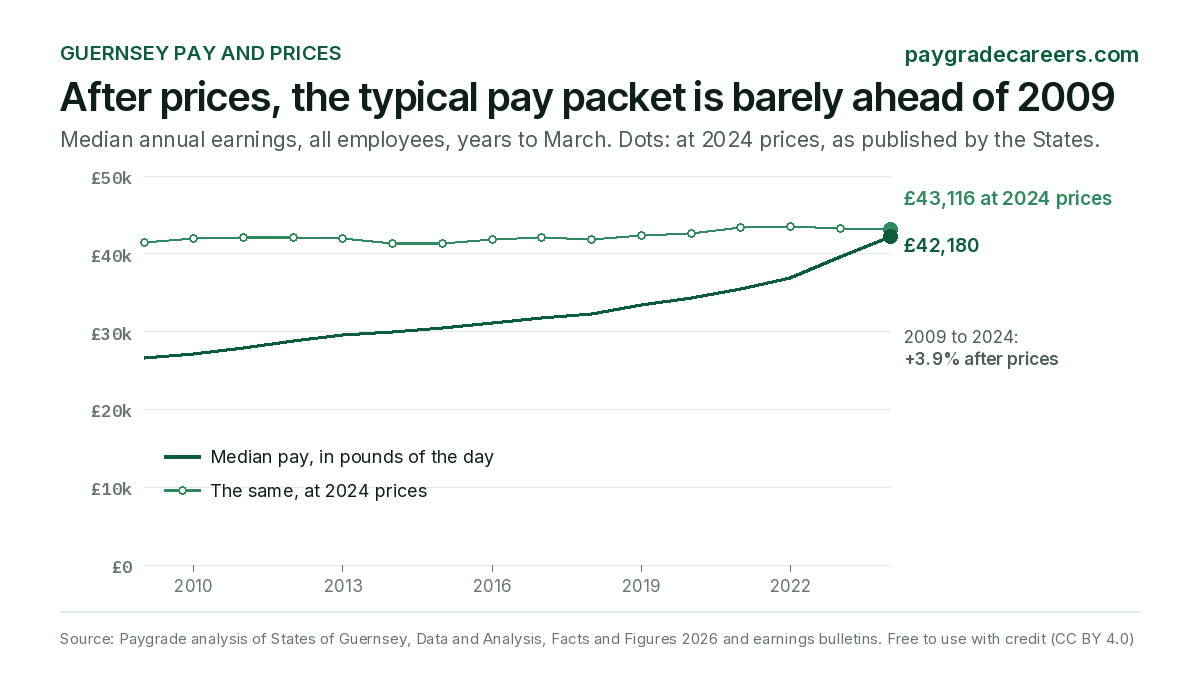
- Fifteen years, £1,601. In the States' year-to-March series at 2024 prices, real median pay went from £41,515 in 2009 to £43,116 in 2024: 3.9% in all. It peaked at £43,483 in 2022, and fell in 6 of 16 years (2013, 2014, 2015, 2018, 2023 and 2024).
- No earnings figure since June 2024. The States' release calendar lists the bulletins for June, September and December 2024 as not provided, and the minimum wage rises of October 2025 and 2026 were set without median earnings data. Over the same time the RPI rose 9.3%: just to keep pace, the June 2024 median of £42,672 would now need to be about £46,700.
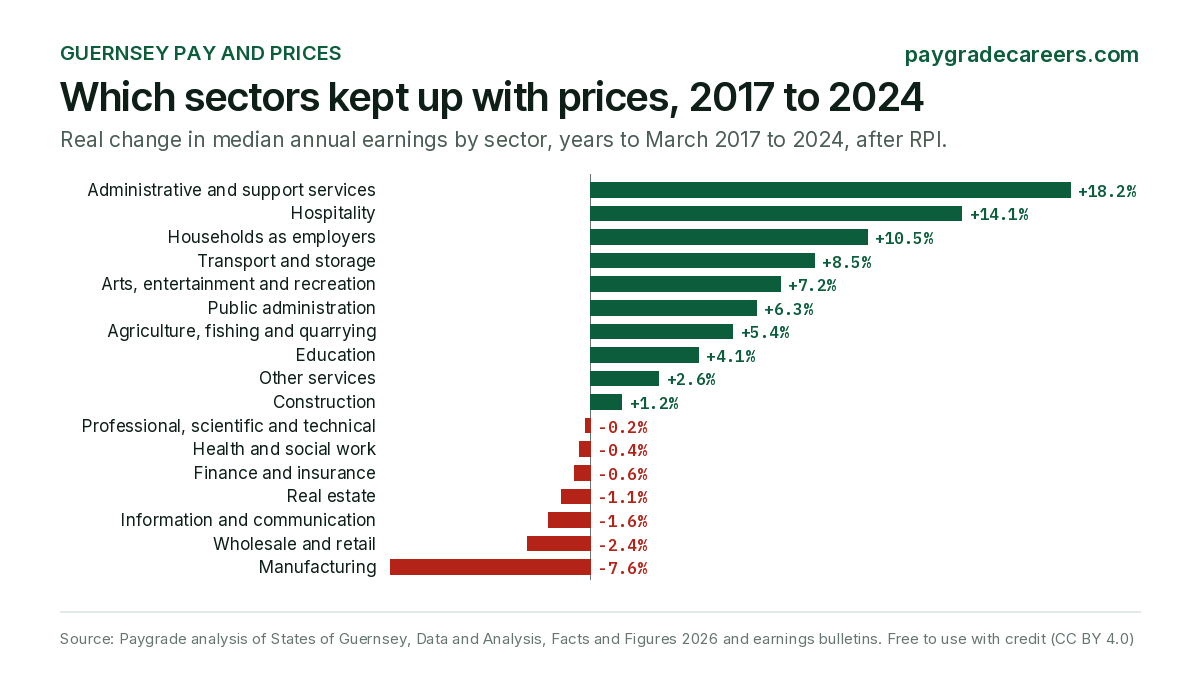
- Hospitality pay beat prices; finance, retail and care didn't. From the year to March 2017 to 2024, the median in accommodation and food rose 14.1% after prices, while finance (-0.6%), retail (-2.4%), health and social work (-0.4%) and manufacturing (-7.6%) ended lower. 7 of 17 sectors were behind 2017 in real terms.
- Finance still pays twice hospitality. In the year to June 2024 the finance median was £57,394, 2.06 times hospitality's £27,914.
- Women's median has closed part of the gap. Women's median earnings were 15.0% below men's in 2024 (£39,155 against £46,088), down from 19.6% in 2015. These are medians of all employees, part-time included: a comparison of what women and men earn, not of pay for the same work.
Median pay against prices since 2009
The States publishes the median at 2024 prices for every year to March since 2009. The line in pounds of the day rises every year; the line at 2024 prices shows what each year's median would buy in 2024, and has barely moved.
Median pay, and what it buys at 2024 prices
Median annual earnings of all employees, average of the four quarters to 31 March. 2024 prices as published by the States.
- Median pay: £42,180
- At 2024 prices: £43,116
Median pay: 2009 £26,714; 2010 £27,238; 2011 £27,893; 2012 £28,809; 2013 £29,595; 2014 £29,988; 2015 £30,485; 2016 £31,215; 2017 £31,773; 2018 £32,305; 2019 £33,530; 2020 £34,409; 2021 £35,497; 2022 £36,982; 2023 £39,647; 2024 £42,180. At 2024 prices: 2009 £41,515; 2010 £42,004; 2011 £42,060; 2012 £42,055; 2013 £41,940; 2014 £41,370; 2015 £41,273; 2016 £41,824; 2017 £42,056; 2018 £41,849; 2019 £42,378; 2020 £42,618; 2021 £43,339; 2022 £43,483; 2023 £43,199; 2024 £43,116.
Every year to March, 2009 to 2024
| Year to March | Median pay | Change | At 2024 prices | Real change |
|---|---|---|---|---|
| 2024 | £42,180 | +6.4% | £43,116 | -0.2% |
| 2023 | £39,647 | +7.2% | £43,199 | -0.7% |
| 2022 | £36,982 | +4.2% | £43,483 | +0.3% |
| 2021 | £35,497 | +3.2% | £43,339 | +1.7% |
| 2020 | £34,409 | +2.6% | £42,618 | +0.6% |
| 2019 | £33,530 | +3.8% | £42,378 | +1.3% |
| 2018 | £32,305 | +1.7% | £41,849 | -0.5% |
| 2017 | £31,773 | +1.8% | £42,056 | +0.6% |
| 2016 | £31,215 | +2.4% | £41,824 | +1.3% |
| 2015 | £30,485 | +1.7% | £41,273 | -0.2% |
| 2014 | £29,988 | +1.3% | £41,370 | -1.4% |
| 2013 | £29,595 | +2.7% | £41,940 | -0.3% |
| 2012 | £28,809 | +3.3% | £42,055 | 0.0% |
| 2011 | £27,893 | +2.4% | £42,060 | +0.1% |
| 2010 | £27,238 | +2.0% | £42,004 | +1.2% |
| 2009 | £26,714 | +5.2% | £41,515 | +2.3% |
The year-to-March series ends in March 2024. The bulletins give the year to June 2024 too: £42,672, 0.7% lower after prices than a year earlier. Their real-terms tables also show the four quarters to December 2021 at £44,252 in June 2024 prices (our chaining of the 2023 and 2024 bulletins' published real values), against £43,510 for the year to June 2024: the 1.7% gap in the summary.
Two years of prices, no pay figure
The last earnings bulletin was issued on 29 October 2024 and covers the four quarters to June 2024. The States' 2026 release calendar says the June, September and December 2024 bulletins "could not be provided in 2025 as a result of operational changes in areas that supply data to the Data and Analysis Service", with no new dates. Prices kept moving:
| June 2024 | September 2026 | Change | |
|---|---|---|---|
| RPI, all items (September 2021 = 100) | 120.0 | 131.2 | +9.3% |
| Adult minimum wage, an hour | £12.00 (from October 2024) | £13.10 (from October 2026) | +9.2% |
| Median annual earnings | £42,672 | not published |
RPI: States of Guernsey inflation workbook to September 2026 (annual RPI 4.6%, RPIX 4.5% in the year to September 2026). Minimum wage: Policy Letter P.2026/50 and gov.gg.
The minimum wage shows what the gap means in practice. In 2024 the adult rate reached £12.00 an hour, 60% of median earnings for a 40-hour week, the target the States had set. Policy Letter P.2026/50 says the October 2025 rise to £12.60 "did not take account of median earnings data, as this was not available at that time", and that "due to an ongoing IT issue" the October 2026 rise, to £13.10, was guided by RPIX inflation instead. Hours data, which would allow a full-time or hourly pay figure, has been delayed by the same problems.
Which sectors kept up
Sector medians from the year to March 2017 to the year to March 2024, set against the RPI's rise over the same years (29.5%, average of each year's four quarters). The States publishes the medians; the real changes are our arithmetic, and the same method gives the States' own all-employee figure.
Real change in median pay by sector, 2017 to 2024
Median annual earnings by sector, years to March, after RPI. Sectors the States publishes for both years.
- Administrative and support services +18.2%
- Hospitality (accommodation and food) +14.1%
- Households as employers +10.5%
- Transport and storage +8.5%
- Arts, entertainment and recreation +7.2%
- Public administration +6.3%
- Agriculture, fishing and quarrying +5.4%
- Education +4.1%
- Other services +2.6%
- Construction +1.2%
- Professional, scientific and technical -0.2%
- Health and social work -0.4%
- Finance and insurance -0.6%
- Real estate -1.1%
- Information and communication -1.6%
- Wholesale and retail -2.4%
- Manufacturing -7.6%
| Sector | Year to March 2017 | Year to March 2024 | Change | After prices |
|---|---|---|---|---|
| Administrative and support services | £25,826 | £39,524 | +53.0% | +18.2% |
| Hospitality (accommodation and food) | £18,614 | £27,513 | +47.8% | +14.1% |
| Households as employers | £18,792 | £26,884 | +43.1% | +10.5% |
| Transport and storage | £26,762 | £37,589 | +40.5% | +8.5% |
| Arts, entertainment and recreation | £21,613 | £29,990 | +38.8% | +7.2% |
| Public administration | £34,454 | £47,448 | +37.7% | +6.3% |
| Agriculture, fishing and quarrying | £26,860 | £36,644 | +36.4% | +5.4% |
| Education | £26,082 | £35,173 | +34.9% | +4.1% |
| Other services | £19,038 | £25,299 | +32.9% | +2.6% |
| Construction | £31,662 | £41,472 | +31.0% | +1.2% |
| Professional, scientific and technical | £40,003 | £51,706 | +29.3% | -0.2% |
| Health and social work | £23,191 | £29,921 | +29.0% | -0.4% |
| Finance and insurance | £44,142 | £56,837 | +28.8% | -0.6% |
| Real estate | £32,455 | £41,558 | +28.0% | -1.1% |
| Information and communication | £36,465 | £46,480 | +27.5% | -1.6% |
| Wholesale and retail | £22,415 | £28,317 | +26.3% | -2.4% |
| Manufacturing | £27,805 | £33,266 | +19.6% | -7.6% |
The bulletins say sector earnings are "based on earnings per role and are unadjusted for the number of hours worked", so a change in part-time working moves a sector's median as well as pay rates do. Hospitality's rise came over the same years as the minimum wage's climb towards 60% of the median; the States doesn't attribute it.
What each sector paid in the year to June 2024
| Sector | Lower quartile | Median | Upper quartile | Median against all employees |
|---|---|---|---|---|
| Finance and insurance | £39,159 | £57,394 | £86,620 | +34.5% |
| Professional, scientific and technical | £35,351 | £52,110 | £79,489 | +22.1% |
| Public administration | £34,052 | £47,899 | £64,283 | +12.2% |
| Information and communication | £32,650 | £46,817 | £66,263 | +9.7% |
| Construction | £31,963 | £41,918 | £52,779 | -1.8% |
| Real estate | £29,153 | £41,744 | £58,470 | -2.2% |
| Electricity, gas and water | £32,197 | £40,930 | £53,270 | -4.1% |
| Administrative and support services | £27,650 | £40,046 | £57,804 | -6.2% |
| Transport and storage | £29,155 | £38,229 | £52,696 | -10.4% |
| Agriculture, fishing and quarrying | £25,035 | £36,511 | £51,204 | -14.4% |
| Education | £24,201 | £35,796 | £58,765 | -16.1% |
| Manufacturing | £23,407 | £33,614 | £45,985 | -21.2% |
| Health and social work | £20,465 | £30,253 | £41,323 | -29.1% |
| Arts, entertainment and recreation | £20,081 | £30,229 | £44,680 | -29.2% |
| Wholesale and retail | £20,278 | £28,717 | £39,373 | -32.7% |
| Hospitality (accommodation and food) | £22,424 | £27,914 | £33,961 | -34.6% |
| Other services | £17,693 | £26,325 | £36,667 | -38.3% |
| Households as employers | £15,160 | £24,690 | £38,506 | -42.1% |
| All employees | £29,723 | £42,672 | £62,335 |
Earnings bulletin, June 2024, Table 6.4.1 (four-quarter averages, annualised).
Women and men
The States publishes the median earnings of women and of men among all employees. Women's median has risen faster: from £27,234 to £39,155 between 2015 and 2024 (about 7.7% after prices), against £33,890 to £46,088 for men (about 1.9%). The gap between them narrowed from 19.6% to 15.0%.
Women's median earnings below men's
All employees, part-time included, four quarters to June.
- Gap: 15.0%
Gap: 2015 19.6%; 2016 18.4%; 2017 19.0%; 2018 18.1%; 2019 17.5%; 2020 16.9%; 2021 15.5%; 2022 16.2%; 2023 15.9%; 2024 15.0%.
| Four quarters to June | Women | Men | Women below men |
|---|---|---|---|
| 2024 | £39,155 | £46,088 | 15.0% |
| 2023 | £37,009 | £43,996 | 15.9% |
| 2022 | £34,068 | £40,636 | 16.2% |
| 2021 | £32,942 | £38,980 | 15.5% |
| 2020 | £31,231 | £37,590 | 16.9% |
| 2019 | £30,330 | £36,780 | 17.5% |
| 2018 | £29,452 | £35,977 | 18.1% |
| 2017 | £28,555 | £35,256 | 19.0% |
| 2016 | £28,024 | £34,349 | 18.4% |
| 2015 | £27,234 | £33,890 | 19.6% |
Part-time work is more common among women and these medians don't adjust for hours, so much of the gap reflects hours and the jobs people do. The States' own earlier bulletin warned its male and female figures were "not intended to be used as a measure of pay equality".
The spread of pay
A quarter of employees earn less than the lower quartile and a quarter more than the upper. Since 2015 the bottom quarter has gained slightly on the top: the upper quartile was 2.15 times the lower in 2015 and 2.1 times in 2024.
| Four quarters to June | Lower quartile | Median | Upper quartile |
|---|---|---|---|
| 2024 | £29,723 | £42,672 | £62,335 |
| 2023 | £28,090 | £40,508 | £59,225 |
| 2022 | £26,132 | £37,387 | £54,377 |
| 2021 | £24,963 | £36,018 | £53,001 |
| 2020 | £23,966 | £34,479 | £50,569 |
| 2019 | £23,280 | £33,622 | £49,381 |
| 2018 | £22,641 | £32,777 | £48,313 |
| 2017 | £22,016 | £31,906 | £46,838 |
| 2016 | £21,583 | £31,406 | £46,284 |
| 2015 | £20,994 | £30,606 | £45,070 |
Earnings bulletins, June 2016 to June 2024 (Q2 rows as printed). From 2015 to 2024 the lower quartile rose 41.6%, the median 39.4% and the upper quartile 38.3% before prices.
Homes against earnings
In the second quarter of 2024 the average purchase price was 14.5 times median earnings, and a year's average rent 0.55 times. There is no later ratio, because there are no later earnings figures.
| Quarter | Purchase price to earnings | Rent to earnings |
|---|---|---|
| Q2 2021 | 13.9 | 0.49 |
| Q2 2022 | 15.4 | 0.55 |
| Q2 2023 | 15.7 | 0.54 |
| Q2 2024 | 14.5 | 0.55 |
Facts and Figures 2026, Table 3.14: purchase prices and annualised rents against annualised earnings from employment.
Use these charts
Both charts are free to use in your own article or broadcast, with credit (CC BY 4.0): please credit "Paygrade analysis of States of Guernsey data" and link to this page.
How we did it
- Pay: the States' median annual earnings of all employees: the middle value of annualised earnings from employment, full-time and part-time together, not adjusted for hours, averaged over four quarters. It is not a full-time or hourly figure, and it leaves out self-employment income. Values to December 2014 are the States' own back-estimates.
- Real pay: the year-to-March series at 2024 prices is published by the States (Facts and Figures 2026). The comparison with late 2021 chains the real values printed in the June 2023 and June 2024 bulletins at June 2023, because the States changed its real-terms method between those bulletins and figures from either side can't be joined directly.
- Sectors: medians for the years to March 2017 and 2024 from the Facts and Figures workbook, divided by the change in the average RPI of each year's four quarters. The same method gives the States' published all-employee change (+2.5%). Electricity and water are left out, because they are separate in 2017 and combined in 2024.
- Since June 2024: the RPI rise uses the all items index (September 2021 = 100) from the States' inflation workbook. The figure that keeps pace is the June 2024 median multiplied by that rise; it is approximate, because the median is a four-quarter average and the price change is quarter to quarter.
- Limits: there is no public and private sector split, no occupation table and no age table after 2015. We don't compare with UK figures, because the UK headline counts full-time employees only. Earnings after June 2024 are not published; nothing here estimates them.
Download the year-to-March series, 2009 to 2024, as CSV. Free to reuse under CC BY 4.0: please credit "Paygrade analysis of States of Guernsey data" and link to this page. Journalists: email hello@paygradecareers.com for any cut of the figures.
Sources
- States of Guernsey, Data and Analysis, Quarterly Population, Employment and Earnings Bulletin, issued 29 October 2024 (earnings to June 2024): Tables 6.1.1 to 6.4.1; and the June bulletins 2016 to 2023.
- States of Guernsey, Facts and Figures 2026, supplementary data: Tables 2.8, 2.9 and 3.14.
- States of Guernsey, Retail Prices Index: Inflation Bulletin and historical workbook to September 2026.
- States of Guernsey, Policy Letter P.2026/50 (minimum wage), and the earnings and population and employment pages.