Paygrade study · Jersey · Statistics Jersey earnings data
Is Jersey pay keeping up with prices?
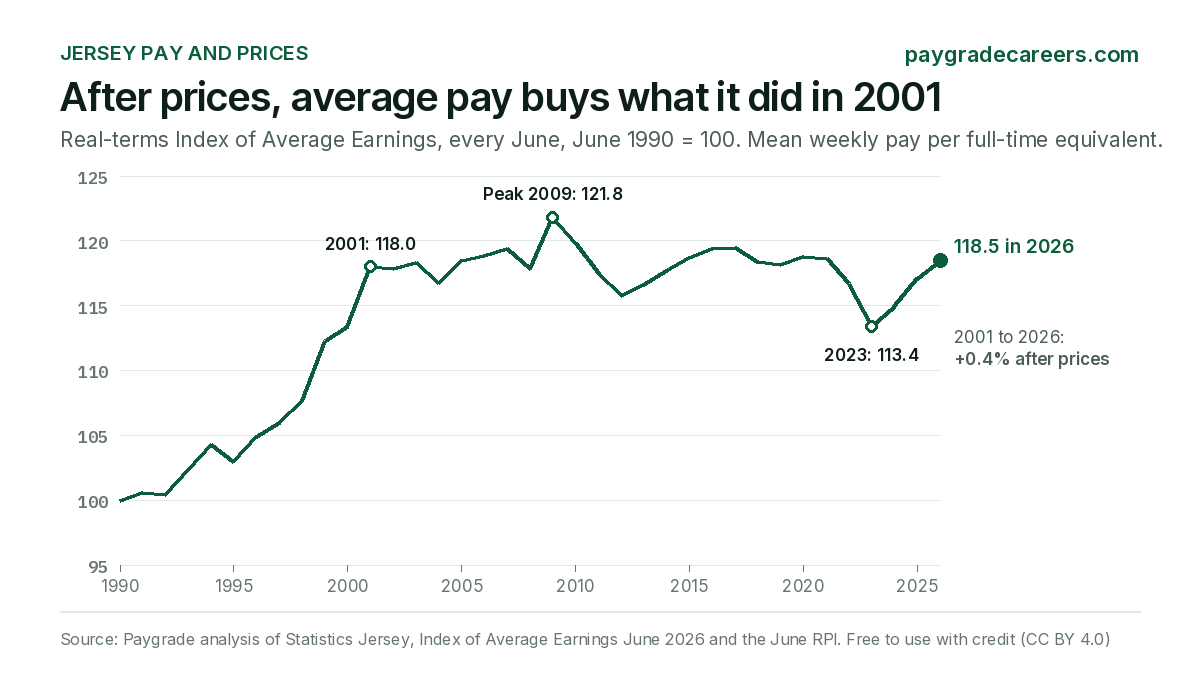
Average earnings in Jersey rose 4.1% in the year to June 2026, ahead of prices (2.8%). But after a quarter of a century of pay rises, average pay buys almost exactly what it did in 2001: Statistics Jersey's real earnings index stood at 118.0 in June 2001 and 118.5 in June 2026, still 2.7% below its 2009 peak.
By Dominic Roworth · Published 19 November 2026 · Data: Statistics Jersey, Index of Average Earnings and Earnings Statistics (published 21 August 2026), Gender pay gap in Jersey (published 11 March 2026) and the Retail Prices Index (to September 2026)
What the data shows
- Twenty-five years without a real pay rise. Statistics Jersey's own figure: "over the long term (25 years), average earnings have increased in real terms by 0.4%". Since June 2009 the earnings index has risen 72.6% and the June RPI 77.4%.
- Pay beat prices in only 5 of the last 10 years. Average pay fell behind prices in 2018, 2019, 2021, 2022 and 2023. The squeeze from 2020 to 2023 cost 4.6% and left real pay in June 2023 exactly where it was in June 2000. Three years of recovery have followed.
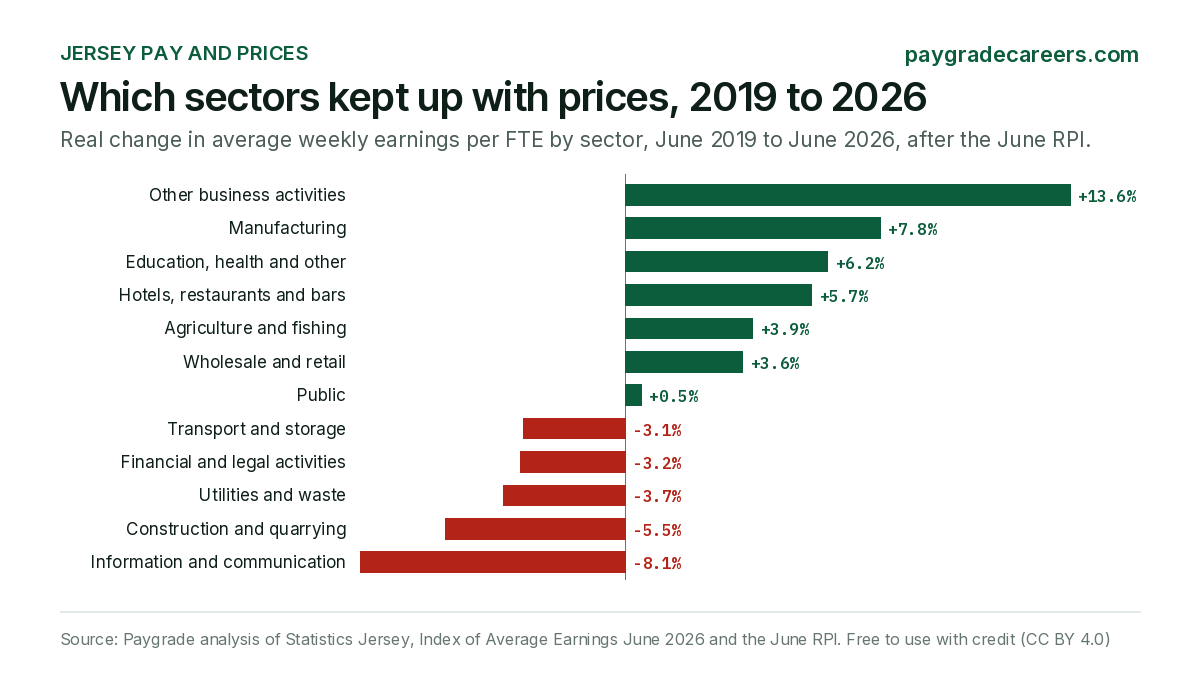
- Since 2019 most lower-paid sectors gained, while finance, construction and IT fell behind. After prices, hotels, restaurants and bars (+5.7%) and wholesale and retail (+3.6%) are ahead of June 2019, while finance (-3.2%), construction (-5.5%) and information and communication (-8.1%) are behind. 5 of 12 sectors are below 2019 in real terms.
- Public sector pay has lost ground over 25 years. Statistics Jersey: public sector average earnings fell 3.0% in real terms over the period, while private sector earnings rose 1.2%. The public sector fell behind prices in 2021, 2022 and 2023 and has outpaced them since.
- One in twelve private sector workers is paid exactly the minimum wage. 8% in June 2025, up from 2% in 2022, after the minimum wage rose 41% from £9.22 to £13.00 an hour. In hotels, restaurants and bars it was 31%.
- Finance pays twice what hospitality does. A year at the median, full-time equivalent, came to £63,280 in finance and £30,750 in hotels, restaurants and bars in 2025, against £44,210 for all jobs.
- The gender pay gap is small overall but wide inside most sectors. Men's median hourly rate was 5.4% above women's in June 2025, but the gap is wider in 10 of 12 sectors, and 64.3% for finance workers aged 55 to 59.
Average pay against prices since 1990
Statistics Jersey's Index of Average Earnings follows mean weekly pay per full-time equivalent employee every June since 1990. Its real-terms index divides it by the June RPI: 100 is what average pay bought in June 1990. Real pay rose 18% from 1990 to 2001, then went flat: it has stayed between 113.4 and 121.8 ever since.
What average pay buys, June 1990 = 100
Index of Average Earnings divided by the June RPI. Mean weekly pay per full-time equivalent employee.
- June 2026: 118.5
Real average earnings: 1990 100.0; 1991 100.6; 1992 100.4; 1993 102.4; 1994 104.3; 1995 103.0; 1996 104.9; 1997 106.0; 1998 107.7; 1999 112.3; 2000 113.4; 2001 118.0; 2002 117.9; 2003 118.3; 2004 116.7; 2005 118.5; 2006 118.9; 2007 119.4; 2008 117.9; 2009 121.8; 2010 119.8; 2011 117.5; 2012 115.8; 2013 116.6; 2014 117.7; 2015 118.7; 2016 119.4; 2017 119.5; 2018 118.4; 2019 118.2; 2020 118.8; 2021 118.6; 2022 116.7; 2023 113.4; 2024 114.9; 2025 117.1; 2026 118.5.
Every June, 1990 to 2026
| June | Earnings index | Change | Prices (RPI) | Real index | Real change |
|---|---|---|---|---|---|
| 2026 | 445.3 | +4.1% | +2.8% | 118.5 | +1.2% |
| 2025 | 427.8 | +4.5% | +2.6% | 117.1 | +1.9% |
| 2024 | 409.3 | +6.4% | +5.0% | 114.9 | +1.3% |
| 2023 | 384.8 | +7.7% | +10.9% | 113.4 | -2.8% |
| 2022 | 357.2 | +6.2% | +7.9% | 116.7 | -1.6% |
| 2021 | 336.5 | +3.3% | +3.5% | 118.6 | -0.2% |
| 2020 | 325.8 | +1.1% | +0.5% | 118.8 | +0.5% |
| 2019 | 322.3 | +2.6% | +2.8% | 118.2 | -0.2% |
| 2018 | 314.0 | +3.5% | +4.5% | 118.4 | -0.9% |
| 2017 | 303.4 | +2.6% | +2.5% | 119.5 | +0.1% |
| 2016 | 295.8 | +2.1% | +1.5% | 119.4 | +0.6% |
| 2015 | 289.7 | +1.8% | +0.9% | 118.7 | +0.8% |
| 2014 | 284.5 | +2.6% | +1.6% | 117.7 | +0.9% |
| 2013 | 277.4 | +2.2% | +1.5% | 116.6 | +0.7% |
| 2012 | 271.4 | +1.5% | +3.0% | 115.8 | -1.4% |
| 2011 | 267.3 | +2.5% | +4.5% | 117.5 | -1.9% |
| 2010 | 260.9 | +1.1% | +2.8% | 119.8 | -1.6% |
| 2009 | 258.0 | +3.0% | -0.4% | 121.8 | +3.3% |
| 2008 | 250.6 | +4.3% | +5.6% | 117.9 | -1.3% |
| 2007 | 240.2 | +4.7% | +4.3% | 119.4 | +0.4% |
| 2006 | 229.5 | +3.3% | +2.9% | 118.9 | +0.3% |
| 2005 | 222.2 | +5.3% | +3.6% | 118.5 | +1.5% |
| 2004 | 211.1 | +3.3% | +4.8% | 116.7 | -1.4% |
| 2003 | 204.3 | +4.7% | +4.2% | 118.3 | +0.3% |
| 2002 | 195.2 | +4.2% | +4.2% | 117.9 | -0.1% |
| 2001 | 187.4 | +8.1% | +3.9% | 118.0 | +4.1% |
| 2000 | 173.4 | +5.5% | +4.4% | 113.4 | +1.0% |
| 1999 | 164.3 | +7.6% | +3.3% | 112.3 | +4.3% |
| 1998 | 152.7 | +6.4% | +4.7% | 107.7 | +1.6% |
| 1997 | 143.5 | +4.7% | +3.5% | 106.0 | +1.0% |
| 1996 | 137.1 | +5.0% | +3.2% | 104.9 | +1.8% |
| 1995 | 130.6 | +2.3% | +3.5% | 103.0 | -1.2% |
| 1994 | 127.7 | +4.6% | +2.6% | 104.3 | +1.9% |
| 1993 | 122.1 | +6.1% | +4.0% | 102.4 | +2.0% |
| 1992 | 115.1 | +6.0% | +6.2% | 100.4 | -0.2% |
| 1991 | 108.6 | +8.6% | +8.0% | 100.6 | +0.6% |
| 1990 | 100.0 | +9.4% | 100.0 |
Both indices June 1990 = 100; RPI change is the all items index, June on June. Real pay rose in 23 of 36 years.
Part of the 2009 peak is a price effect: Jersey's RPI fell in the year to June 2009 while pay rose. The 2001 comparison doesn't depend on that. The 2020 to 2023 squeeze does: prices rose 7.9% in the year to June 2022 and 10.9% in the year to June 2023, faster than pay in both years.
Which sectors kept up since 2019
Statistics Jersey publishes each sector's annual change in average earnings on one consistent basis since June 2019. We added them up year by year and set them against the June RPI, up 37.7% from June 2019 to June 2026. All sectors together are +0.4% after prices. Miscellaneous business activities gained most (+13.6%); information and communication fell furthest behind (-8.1%).
Real change in average pay by sector, 2019 to 2026
Mean weekly earnings per full-time equivalent, June on June, after the June RPI.
- Miscellaneous business activities +13.6%
- Manufacturing +7.8%
- Private education, health and other services +6.2%
- Hotels, restaurants and bars +5.7%
- Agriculture and fishing +3.9%
- Wholesale and retail +3.6%
- Public +0.5%
- Transport and storage -3.1%
- Financial and legal activities -3.2%
- Utilities and waste -3.7%
- Construction and quarrying -5.5%
- Information and communication -8.1%
| Sector | Change since June 2019 | After prices | Average weekly pay, June 2026 |
|---|---|---|---|
| Miscellaneous business activities | +56.4% | +13.6% | £1,070 |
| Manufacturing | +48.4% | +7.8% | £930 |
| Private education, health and other services | +46.3% | +6.2% | £900 |
| Hotels, restaurants and bars | +45.6% | +5.7% | £690 |
| Agriculture and fishing | +43.0% | +3.9% | £880 |
| Wholesale and retail | +42.7% | +3.6% | £790 |
| Public | +38.4% | +0.5% | £1,350 |
| Transport and storage | +33.4% | -3.1% | £1,110 |
| Financial and legal activities | +33.3% | -3.2% | £1,420 |
| Utilities and waste | +32.6% | -3.7% | £1,210 |
| Construction and quarrying | +30.1% | -5.5% | £1,030 |
| Information and communication | +26.6% | -8.1% | £1,180 |
| All sectors | +38.3% | +0.4% | £1,100 |
Weekly pay is the mean per full-time equivalent, bonuses excluded, rounded to £10 by Statistics Jersey, which calls the levels indicative (about plus or minus £20). Averages move with the mix of jobs as well as with pay rates. The lower-paid sectors' gains came over the same years as the minimum wage's 41% rise from June 2022 to June 2025; Statistics Jersey doesn't attribute them.
A year's pay at the median, by sector, 2025
A second source, the administrative earnings data, covers every job each month and gives medians. Statistics Jersey adds the twelve monthly medians to get a year's pay at the median: £44,210 for all jobs in 2025, full-time equivalent. The same sum by sector:
| Sector | Median, 2025 | Mean, 2025 |
|---|---|---|
| Financial and legal activities | £63,280 | £87,700 |
| Information and communication | £57,620 | £72,810 |
| Public | £57,300 | £63,390 |
| Utilities and waste | £49,090 | £60,470 |
| Construction and quarrying | £44,160 | £51,890 |
| Miscellaneous business activities | £41,420 | £65,150 |
| Transport and storage | £39,960 | £48,390 |
| Manufacturing | £37,750 | £43,460 |
| Private education, health and other services | £37,600 | £48,600 |
| Agriculture and fishing | £36,260 | £41,310 |
| Wholesale and retail | £31,790 | £40,600 |
| Hotels, restaurants and bars | £30,750 | £36,590 |
| All jobs | £44,210 | £60,820 |
Statistics Jersey, Earnings Statistics, December 2025 (open data: earnings by sector). Sums of the twelve monthly medians and means of 2025, each job adjusted to full time, bonuses included, rounded to £10; the sector rows are Paygrade calculations with the method that gives Statistics Jersey's £44,210 and £60,820. Jobs, not people: someone with two jobs counts twice.
The mean is well above the median, because high earners pull it up: Statistics Jersey says "around two-thirds of workers earn less than the mean earnings". In June 2026 the mean was £1,100 a week per full-time equivalent and its estimate of the median £930. In December 2025 the median job paid £3,900 a month, about £23.07 an hour.
Public and private sector pay
Over 25 years, Statistics Jersey finds public sector average earnings 3.0% lower in real terms and private sector earnings 1.2% higher. Year by year since 2019, the public sector fell behind prices for three years running, worst in the year to June 2022 (-4.4%), then caught up: since June 2019 both are close to level after prices (public +0.5%, private +0.4%).
| Year to June | Public | Private | Prices (RPI) | Public, real | Private, real |
|---|---|---|---|---|---|
| 2026 | +5.8% | +3.7% | +2.8% | +2.9% | +0.9% |
| 2025 | +4.8% | +4.5% | +2.6% | +2.1% | +1.9% |
| 2024 | +8.8% | +5.9% | +5.0% | +3.6% | +0.9% |
| 2023 | +7.6% | +7.8% | +10.9% | -3.0% | -2.8% |
| 2022 | +3.2% | +6.7% | +7.9% | -4.4% | -1.1% |
| 2021 | -0.2% | +4.0% | +3.5% | -3.6% | +0.5% |
| 2020 | +3.5% | +0.7% | +0.5% | +3.0% | +0.2% |
| 2019 | +4.2% | +2.4% | +2.8% | +1.4% | -0.4% |
Index of Average Earnings, Table A2 (SIC 2007) and the June RPI; real changes are Paygrade calculations. In the year to June 2026 the public sector rise followed "a 3.8% headline pay award" plus a new framework for education support staff and more employed doctors in Health and Care Jersey (June 2026 report). The year to June 2021 (-0.2% in cash) is as published.
Who is paid the minimum wage
Every three years the earnings survey asks private sector employers how many staff they pay the minimum wage. In June 2025, with the rate at £13.00, 8% of private sector employees were paid exactly that, against 2% in 2022 (at £9.22) and 5% in 2019. 19% were paid £14.30 or less.
| Sector (private) | Employees, 2025 | On the minimum wage, 2025 | On the minimum wage, 2022 | £14.30 or less, 2025 |
|---|---|---|---|---|
| Agriculture and fishing | 1,120 | 49% | 21% | 70% |
| Construction and quarrying | 6,320 | 2% | under 1% | 6% |
| Private education, health and other services | 9,040 | 3% | 1% | 10% |
| Financial and legal activities | 13,770 | under 1% | under 1% | 1% |
| Hotels, restaurants and bars | 6,350 | 31% | 8% | 57% |
| Information and communication | 1,800 | under 1% | under 1% | 4% |
| Manufacturing | 920 | 1% | under 1% | 7% |
| Miscellaneous business activities | 6,310 | 3% | 1% | 23% |
| Transport and storage | 2,160 | under 1% | under 1% | 1% |
| Utilities and waste | 780 | under 1% | under 1% | 1% |
| Wholesale and retail | 6,920 | 17% | 1% | 47% |
| All private sectors | 55,490 | 8% | 2% | 19% |
Index of Average Earnings, June 2025, Tables 1 and 2 (June 2022 restated on the 2025 sectors). The £14.30 line is the minimum wage plus 10%, a threshold set at the request of Government of Jersey policy officers; in 2022 the report used the minimum wage plus 5%, so only the "on the minimum wage" shares compare across years. In June 2023, 14% of private sector employees were paid less than the £12.19 Jersey Living Wage (June 2023 report).
In hotels, restaurants and bars, 31% of staff were paid the minimum wage in 2025, up from 8% in 2022; 49% in agriculture and fishing and 17% in wholesale and retail. As the minimum wage rose faster than most pay, more jobs ended up at it.
Women and men
In June 2025 the median hourly rate was £22.88 for men and £21.70 for women: a gap of 5.4% on Statistics Jersey's measure, which says how much more men earn than women. Over twelve months the gap averaged 6.0%, down from 7.8% a year earlier. Inside sectors it is wider: information and communication 30.0%, and more than 5.4% in 10 of 12 sectors.
Gender pay gap by sector, June 2025
How much higher men's median hourly rate is than women's (Statistics Jersey's measure).
- Information and communication 30.0%
- Manufacturing 29.7%
- Financial and legal activities 22.1%
- Miscellaneous business activities 20.3%
- Public 18.4%
- Construction and quarrying 17.2%
- Transport and storage 10.1%
- Hotels, restaurants and bars 9.6%
- Wholesale and retail 9.1%
- Agriculture and fishing 7.3%
- Private education, health and other services 4.8%
- Utilities and waste -3.4%
| Age | All sectors | Financial and legal activities |
|---|---|---|
| 16-19 | 0.0% | not published |
| 20-24 | 1.7% | -0.3% |
| 25-29 | -2.2% | -1.8% |
| 30-34 | 2.1% | 11.9% |
| 35-39 | 2.8% | 16.8% |
| 40-44 | 6.6% | 31.6% |
| 45-49 | 13.7% | 39.8% |
| 50-54 | 11.2% | 47.8% |
| 55-59 | 13.3% | 64.3% |
| 60-64 | 11.3% | 63.7% |
| 65+ | 11.5% | 61.4% |
Gender pay gap in median hourly rates by age, June 2025 (open data). Statistics Jersey calls the 64.3% for finance workers aged 55 to 59 "the highest gender pay gap for any sector and age combination". Its gap is men's rate divided by women's, minus one; on the UK's measure (the difference as a share of men's rate) the overall gap would be 5.2%. These are medians of all jobs: a comparison of what women and men earn, not of pay for the same work.
Jersey and the UK
Statistics Jersey's administrative earnings use the same method as the UK's payroll figures, so annual changes can be compared (levels can't): "All sector earnings increased by less in Jersey (4.6%), compared with the UK (5.5%), in the period January 2025 to December 2025."
Use these charts
Both charts are free to use in your own article or broadcast, with credit (CC BY 4.0): please credit "Paygrade analysis of Statistics Jersey data" and link to this page.
How we did it
- Average pay: Statistics Jersey's Index of Average Earnings measures the change in mean gross weekly earnings per full-time equivalent employee each June, from a compulsory survey of about 500 employers plus every Government of Jersey department. It includes overtime and excludes bonuses, holiday pay and benefits in kind. It is an average across jobs, not one person's pay rise: if the mix of jobs changes, the average moves.
- Real pay: the real-terms index is Statistics Jersey's own (nominal index divided by the June RPI). The 25-year, peak and 2020 to 2023 figures are quoted from its June 2026 report; our counts of years when pay beat prices use its published annual real changes.
- Sectors since 2019: the published annual change for each sector, multiplied together from June 2019 to June 2026, then divided by the rise in the June RPI. Done for all sectors, the same arithmetic gives the index's own change (within rounding). Earlier years use different sector definitions, so we don't join them.
- Medians: from the administrative earnings data (every job, monthly, since January 2022), which includes bonuses; the yearly figures are sums of twelve monthly medians, as Statistics Jersey publishes them.
- Limits: the survey's median before 2022 is an estimate from a household survey, and changed basis in 2022 (from £630 to £750 a week), so we don't use it as a trend. There is no occupation table. Annual changes compare with the UK; levels don't.
Download every June, 1990 to 2026, as CSV. Free to reuse under CC BY 4.0: please credit "Paygrade analysis of Statistics Jersey data" and link to this page. Journalists: email hello@paygradecareers.com for any cut of the figures.
Sources
- Statistics Jersey, Index of Average Earnings, June 2026 (published 21 August 2026): Tables A1 and A2, and the June 2007 to 2025 reports for levels and the minimum wage tables.
- Statistics Jersey, Earnings statistics, December 2025, and its open data.
- Statistics Jersey, Gender pay gap in Jersey, June 2025, and its open data.
- Government of Jersey, opendata.gov.je: Index of Average Earnings, earnings, gender pay gap and RPI files (Open Government Licence - Jersey).