Paygrade study · Isle of Man · Statistics Isle of Man Earnings Survey
Is Isle of Man pay keeping up with prices?
Half of the Isle of Man's full-time employees earned less than £755 a week in June 2025, against £765 a year earlier: a slip too small to be statistically significant, Statistics Isle of Man says. After prices it was a real fall, and the typical full-time pay packet now buys what it did in June 2019. That median is the figure Tynwald voted to tie the minimum wage to, and a review of the policy is due by the end of December 2026.
By Dominic Roworth · Published 21 November 2026 · Data: Statistics Isle of Man, Earnings Survey Report 2025 (published June 2026) and earlier reports, and the Historic Data Sets, December 2025 (published January 2026); Tynwald papers and written answers
What the data shows
- No rise in 2025, and a fall after prices. Median full-time pay was £755 a week in June 2025 (95% confidence interval £740 to £774), against £765 in 2024 (£742 to £780): Statistics Isle of Man finds "no statistically significant differences between 2024 and 2025". Prices rose 2.6% in the year to June. At June 2025 prices the 2024 median was worth £785 and the average £953, so the median fell 3.8% and the average (£920) 3.5% in real terms. The report says adjusting for inflation shows "a statistically-significant fall in all estimates apart from median hourly earnings".
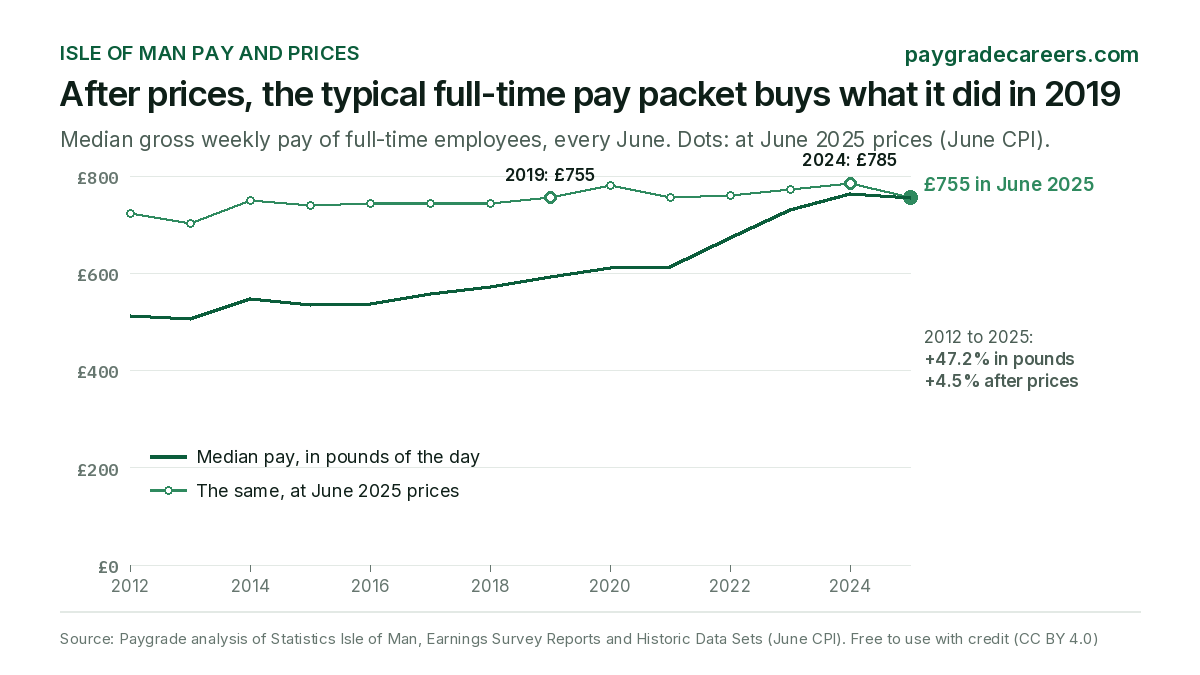
- Back where it was in 2019. After prices, June 2025's £755 buys what £593 bought in June 2019 (£755 at June 2025 prices). Since 2012 the median has risen 47.2% in pounds but 4.5% after prices. Its real high was 2024 (£785), and it fell behind prices in 5 of 13 years (2013, 2015, 2017, 2021 and 2025).
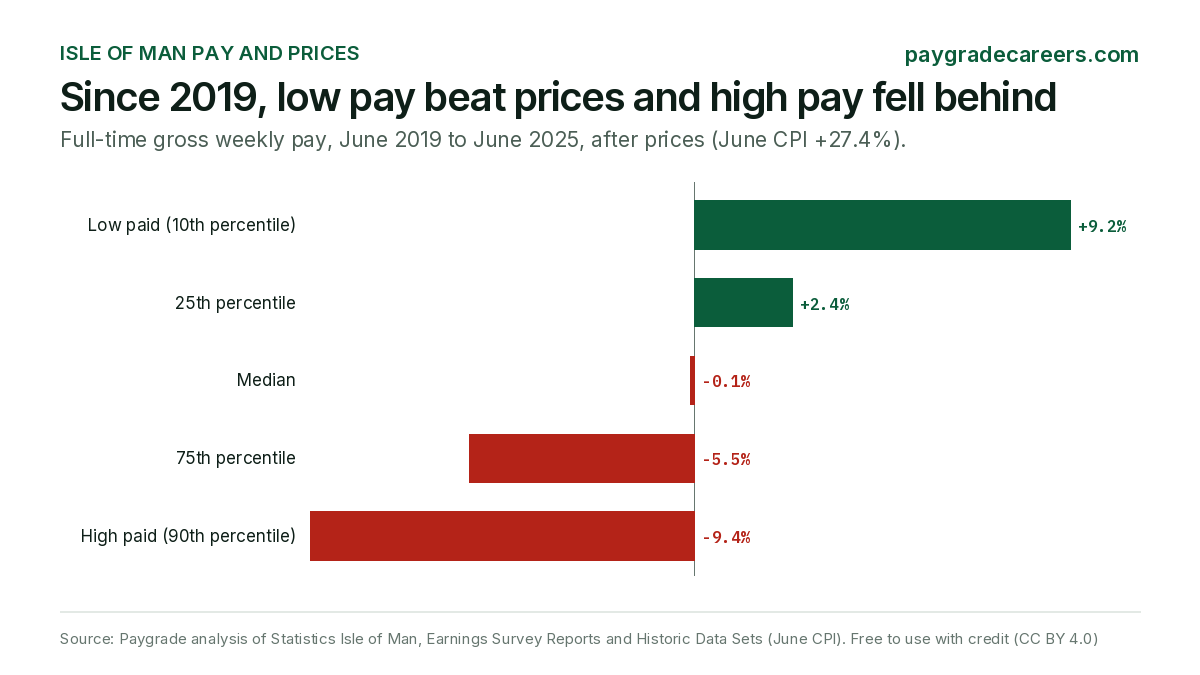
- Low pay beat prices; high pay fell behind. From June 2019 to June 2025, with prices up 27.4%, pay at the 10th percentile rose 39.2% (£365 to £508 a week), 9.2% more than prices. At the 90th percentile it rose 15.4% (£1,250 to £1,442), 9.4% less than prices. The adult minimum wage at the survey date rose 56.1%, from £7.85 to £12.25 an hour.
- The minimum wage peg did not survive. In July 2025 Tynwald voted to set the minimum wage at 66% of median earnings. On the 2024 median that gave £13.46 an hour, approved on 21 October 2025 and revoked before it started. £12.86 (a 5.0% rise) took effect on 1 April 2026, "approximately 63% of median earnings". The same formula on the 2025 median gives £13.29.
- Public sector pay still leads, but the gap narrowed. The public sector median was £828 a week in 2025 and the private sector's £720, a gap of £108. In 2024 it was £196 (£902 against £706), the widest of 2020 to 2024 in the Cabinet Office's figures. Since 2019, against prices up 27.4%, the private sector median rose 26.1% and the public sector's 15.8%.
- Level with the UK. The Manx median was 1.0% above the UK's £747 (April 2025), "not a statistically significant difference"; in 2023 it was 7.3% above. Manx women's median (£741) was 5.9% above UK women's, and men's (£777) 0.9% below UK men's.
Median pay against prices since 2012
The Earnings Survey is compulsory under the Statistics Act 1999: each June, Statistics Isle of Man samples employees from Income Tax records and asks their employers what they were paid. We set the median full-time weekly pay of every June since 2012 against the June Consumer Price Index, the same month and method the survey reports use (uprating 2024 this way gives the 2025 report's own £785). In pounds of the day the median rose 47.2%; at June 2025 prices it moved 4.5%.
Median full-time pay, and what it buys at June 2025 prices
Median gross weekly pay of full-time employees on adult rates, every June. Real values use the June CPI.
- Median pay: £755
- At June 2025 prices: £755
Median pay: 2012 £513; 2013 £506; 2014 £549; 2015 £536; 2016 £537; 2017 £558; 2018 £573; 2019 £593; 2020 £611; 2021 £613; 2022 £673; 2023 £732; 2024 £765; 2025 £755. At June 2025 prices: 2012 £722; 2013 £702; 2014 £749; 2015 £740; 2016 £743; 2017 £743; 2018 £743; 2019 £755; 2020 £781; 2021 £756; 2022 £760; 2023 £773; 2024 £785; 2025 £755.
Every June, 2012 to 2025
| June | Median weekly pay | Change | Prices (June CPI) | At June 2025 prices | Real change |
|---|---|---|---|---|---|
| 2025 | £755 | -1.3% | +2.6% | £755 | -3.8% |
| 2024 | £765 | +4.5% | +3.0% | £785 | +1.5% |
| 2023 | £732 | +8.8% | +6.9% | £773 | +1.8% |
| 2022 | £673 | +9.8% | +9.2% | £760 | +0.5% |
| 2021 | £613 | +0.3% | +3.6% | £756 | -3.1% |
| 2020 | £611 | +3.0% | -0.3% | £781 | +3.4% |
| 2019 | £593 | +3.5% | +1.8% | £755 | +1.7% |
| 2018 | £573 | +2.7% | +2.6% | £743 | +0.1% |
| 2017 | £558 | +3.9% | +4.0% | £743 | -0.1% |
| 2016 | £537 | +0.2% | -0.2% | £743 | +0.4% |
| 2015 | £536 | -2.4% | -1.2% | £740 | -1.2% |
| 2014 | £549 | +8.5% | +1.8% | £749 | +6.6% |
| 2013 | £506 | -1.4% | +1.5% | £702 | -2.8% |
| 2012 | £513 | +1.8% | £722 |
Prices: the June CPI's 12-month change as published (index January 2008 = 100). Real change: the median's change divided by the June CPI's.
We start at 2012 because the reports warn that "A methodological change implemented from 2012 onwards means that average and median earnings prior to 2012 may not be directly comparable." Each median is a sample estimate: in the years with published margins (2020 to 2025), the 95% interval runs roughly £15 to £40 either side, so a move of a few pounds in one year can be noise. Over thirteen years the pattern is clearer: in real terms, the typical full-time wage has hardly moved.
In February 2025 the chair of Tynwald's Select Committee on Poverty asked Statistics Isle of Man whether there was merit in "a more longitudinal version of inflation-adjusted median wages". This series is one, built only from published figures.
June 2025 against June 2024
The 2025 report's summary: employees "have on average experienced little in the way of an increase in their earnings between 2024 and 2025 and that these earnings have not kept pace with inflation". In cash, "The differences in the estimates in Table 1 are sufficiently small that no statistically significant differences between 2024 and 2025 can be identified." After prices, the picture changes.
| Full-time employees | June 2024 | June 2025 | Change | 2024 at June 2025 prices | After prices |
|---|---|---|---|---|---|
| Median weekly pay | £765 (£742 to £780) | £755 (£740 to £774) | -1.3% | £785 | -3.8% |
| Median hourly pay | £19.22 (£18.74 to £19.93) | £19.49 (£18.95 to £19.88) | +1.4% | £19.72 | -1.2% |
| Average weekly pay | £929 (£903 to £957) | £920 (£893 to £949) | -1.0% | £953 | -3.5% |
| Average hourly pay | £24.44 (£23.71 to £25.20) | £24.16 (£23.41 to £24.97) | -1.1% | £25.07 | -3.6% |
Earnings Survey Report 2025, Tables 1 and 2 (95% confidence intervals in brackets; changes are Paygrade calculations). The report: adjusting 2024 for inflation "results in a statistically-significant fall in all estimates apart from median hourly earnings". Median hourly pay divides each employee's pay by their own hours, so it can move differently from weekly pay.
Low pay beat prices, high pay fell behind
The survey also publishes the pay below which a tenth, a quarter and half of full-time employees earn, and above which a quarter and a tenth earn. From June 2019 to June 2025 the bottom of the scale gained on prices and the top lost: the 90th percentile was 3.42 times the 10th in 2019 and 2.84 times in 2025.
Change after prices, June 2019 to June 2025
Full-time gross weekly pay at each point of the distribution, after the June CPI (+27.4%).
- Low paid (10th percentile) +9.2%
- 25th percentile +2.4%
- Median -0.1%
- 75th percentile -5.5%
- High paid (90th percentile) -9.4%
| Full-time weekly pay | June 2019 | June 2023 | June 2025 | Change since 2019 | After prices |
|---|---|---|---|---|---|
| 10% earned less than | £365 | £467 | £508 | +39.2% | +9.2% |
| 25% earned less than | £453 | £562 | £591 | +30.5% | +2.4% |
| Half earned less than | £593 | £732 | £755 | +27.3% | -0.1% |
| 25% earned more than | £854 | £1,014 | £1,028 | +20.4% | -5.5% |
| 10% earned more than | £1,250 | £1,500 | £1,442 | +15.4% | -9.4% |
Over the same years the adult minimum wage in force at the survey date rose from £7.85 to £12.25 (+56.1%, +22.5% after prices), as each report's minimum wage table prints it. The reports don't attribute the change; percentiles from a sample also carry margins of error, which the reports don't publish for them.
The minimum wage and the median
In 2024 the adult minimum wage was 56% of median earnings, according to the Department for Enterprise's review of May 2025 (GD 2025/0048). Tynwald then voted to tie the two together, and the first rate the formula produced never took effect:
- 14 July 2025: Tynwald approves "66% of Median Earnings for April 2026" (Keys 16 to 8, Council 6 to 2), and a review of the policy's impact "by the end of December 2026".
- 2 September 2025: the Minimum Wage Committee declines to recommend £13.46, which "was calculated from the median wage at a rate of 37.5 hours per week". It notes the Chamber of Commerce's concern about the rate being "affected by the median earnings in the public sector (which are higher)", and that the Chamber's representative said "few businesses would be able to support a rise in excess of 5%".
- 21 October 2025: Tynwald approves £13.46 from 1 April 2026. The regulations were later revoked before they started (written answer W-202601-2069).
- 17 February 2026: Tynwald approves £12.86, a 5.0% rise, in force from 1 April 2026: "approximately 63% of median earnings" (GD 2026/0021).
- By the end of December 2026: the review of the 66% policy is due to be published.
What 66% of the median gives an hour
Depending on which median and how many hours a week. The rate in force is highlighted.
- 66% of the 2024 median (£765) over 37.5 hours Approved by Tynwald on 21 October 2025, revoked before it started £13.46
- 66% of the 2025 median (£755) over 37.5 hours The same formula on the newest survey (Paygrade calculation) £13.29
- In force from 1 April 2026 A 5% rise, "approximately 63% of median earnings" £12.86
- 66% of the 2025 median hourly pay (£19.49) The survey's own hourly median, published after the rate was set (Paygrade calculation) £12.86
- 66% of the 2025 private sector median (£720) over 37.5 hours The private sector median on the newest survey (Paygrade calculation) £12.67
- 66% of the 2024 median (£765) over 40 hours The Minimum Wage Committee's alternative £12.62
- 66% of the 2024 private sector median (£706) over 37.5 hours The Committee's other alternative £12.42
The answer depends on which median and how many hours. The 2025 survey, published in June 2026 after the rate was set, puts the median at £755: on that the July 2025 formula gives £13.29, and on the private sector median £12.67. The survey's own median hourly pay (£19.49 in June 2025) divides each person's pay by their actual hours rather than an assumed 37.5; 66% of it is £12.86, the rate now in force.
Below the Living Wage, and on the minimum wage
| Survey year | Employees below the Isle of Man Living Wage |
|---|---|
| 2025 | 27.4% |
| 2024 | 20.1% |
| 2023 | 15.6% |
| 2022 | 16.9% |
| 2021 | 10.1% |
2025 and 2024: Earnings Survey Report 2025; 2023: the 2023 report; 2021 and 2022: Tynwald written answer W-202301-0837. Full-time and part-time employees together. The jump in 2025 "results from a large rise in the Living Wage following a recalibration by the Living Wage Foundation of the basis upon which it is calculated", so it is not a fall in pay. 2.3% of employees earned the minimum wage in 2025, against 1.9% in 2024: "no statistically significant difference".
Public and private sector pay
The public sector median was £828 a week in 2025, 15.0% above the private sector's £720. In 2024 the gap was £196 (margin of error £156 to £254), with the public median 27.8% higher. On the published medians, the private sector's has roughly kept pace with prices since 2019 (-1.0% after prices) and the public sector's has not (-9.1%).
Public, private and all employees
Median gross weekly pay of full-time employees, every June, in pounds of the day.
- Public: £828
- All: £755
- Private: £720
Public sector: 2019 £715; 2020 £739; 2021 £714; 2022 £774; 2023 £797; 2024 £902; 2025 £828. All employees: 2019 £593; 2020 £611; 2021 £613; 2022 £673; 2023 £732; 2024 £765; 2025 £755. Private sector: 2019 £571; 2020 £566; 2021 £582; 2022 £615; 2023 £679; 2024 £706; 2025 £720.
| June | Private sector | Public sector | Gap | Public above private |
|---|---|---|---|---|
| 2025 | £720 (£703 to £734) | £828 (£811 to £876) | £108 | +15.0% |
| 2024 | £706 (£685 to £726) | £902 (£863 to £949) | £196 (£156 to £254) | +27.8% |
| 2023 | £679 (£654 to £702) | £797 (£764 to £828) | £118 (£72 to £160) | +17.4% |
| 2022 | £615 (£590 to £640) | £774 (£734 to £807) | £159 (£118 to £207) | +25.9% |
| 2021 | £582 (£567 to £599) | £714 (£675 to £732) | £132 (£93 to £160) | +22.7% |
| 2020 | £566 (£540 to £583) | £739 (£688 to £758) | £173 (£131 to £214) | +30.6% |
| 2019 | £571 | £715 | £144 | +25.2% |
95% margins of error in brackets where published. The gaps for 2020 to 2024 are the Cabinet Office's own estimates; for 2019 and 2025 they are our subtraction. Statistics Isle of Man: "The public and private sectors have workforces which are composed quite differently. Consequently, differences in weekly earnings do not reveal differences in rates of pay for comparable jobs." The public sector median moves more from year to year (2024's £902 sits well above both 2023 and 2025), so one year's gap says little on its own; from 2019 to 2025 it went from £715 to £828.
Against the UK, and women and men
Each report compares the Manx median with the UK's Annual Survey of Hours and Earnings (April for the UK, June for the Isle of Man). In 2025 the two were level: the Manx median was 1.0% higher, "within the margin of error for the Isle of Man estimate and so is not a statistically significant difference". In 2023 the gap was 7.3% (£732 against £682).
| Median full-time weekly pay, 2025 | Isle of Man (June) | UK (April) | Isle of Man against UK |
|---|---|---|---|
| Women | £741 | £700 | +5.9% |
| Men | £777 | £784 | -0.9% |
| All | £755 | £747 | +1.0% |
Earnings Survey Report 2025, Table 10 (UK figures from ASHE, released 23 October 2025, which may be revised).
On basic pay (overtime, shifts and incentives left out), the report puts the 2025 gender pay gap at 4.6% for median weekly pay (95% confidence interval 0.5% to 8.7%), 9.7% for average weekly pay and -0.6% for median hourly pay, a gap in women's favour within its margin of error. "The calculation of the gender pay gap was completely revised in 2024", so these don't compare with earlier reports' figures. They compare what women and men earn, not pay for the same work.
What each sector paid on average, June 2025
The survey publishes average (mean) pay by economic sector, not medians. Averages run higher than medians, because high earners pull them up: £920 a week for all full-time employees against the median of £755.
| Sector | Average weekly pay | Average weekly hours | Average hourly pay |
|---|---|---|---|
| Other finance and business services | £1,391 | 35.6 | £38.90 |
| Transport and communications | £1,101 | 38.2 | £28.10 |
| Legal and accountancy services | £1,059 | 36.1 | £28.80 |
| Banking | £1,011 | 35.1 | £28.60 |
| Information and communication technology | £984 | 37.1 | £26.50 |
| Utilities | £982 | 39.4 | £23.50 |
| Public administration | £936 | 37.9 | £24.10 |
| Medical and health services | £931 | 37.7 | £23.30 |
| Education | £917 | 34.3 | £27.50 |
| Manufacturing: engineering | £854 | 38.0 | £21.40 |
| Insurance | £829 | 35.8 | £23.10 |
| Manufacturing: general | £806 | 38.0 | £20.40 |
| Tourist accommodation | £796 | 43.5 | £18.50 |
| Wholesale | £783 | 39.3 | £19.70 |
| Manufacturing: food and drink | £779 | 39.1 | £19.80 |
| Construction | £769 | 41.3 | £18.40 |
| Miscellaneous services | £749 | 39.5 | £18.70 |
| Retail | £631 | 39.3 | £15.70 |
| Agriculture, forestry and fishing | £628 | 44.1 | £14.20 |
| Catering and entertainment | £612 | 40.9 | £14.50 |
| Whole economy | £920 | 37.7 | £24.20 |
Earnings Survey Report 2025, Table 11: full-time employees on adult rates, hours including overtime. The report: "the estimates for each sector in this table should be treated with some caution", because sector samples are small; sectors with too small a sample are not published. Average hourly pay is the average of each person's hourly pay, not weekly pay divided by hours.
Use these charts
Both charts are free to use in your own article or broadcast, with credit (CC BY 4.0): please credit "Paygrade analysis of Statistics Isle of Man data" and link to this page.
How we did it
- Pay: the Earnings Survey's median gross weekly pay of full-time employees: those with at least 30 basic hours a week (teachers 25), on adult rates, whose pay that week was not affected by absence. Gross pay includes overtime, incentive pay and shift premiums. In 2025 the survey covered the pay period including 11 June 2025; 3,444 forms came back (98.6% of those sent), 1,835 of them for full-time employees with reported hours.
- Real pay: each June's median multiplied by the June 2025 CPI and divided by that June's CPI (January 2008 = 100), from Statistics Isle of Man's Historic Data Sets. The reports adjust the same way ("The reference month used for the purpose of adjusting by inflation is June"), and the method reproduces the 2025 report's constant-price figures for 2024 (£785 median, £953 average).
- Where each median comes from: 2012 to 2017, Economic Affairs' table of full-time earnings percentiles (Tynwald paper PP 2019/0122); 2018 and 2019, the Earnings Survey Report 2019 (reproduced in PP 2021/0105); 2020 to 2024, the Cabinet Office's written answer W-202501-1645, which matches the 2023 and 2025 reports; 2025, the Earnings Survey Report 2025.
- Percentiles and the minimum wage: the distribution tables of the 2019, 2023 and 2025 reports, and the adult minimum wage each report lists for its survey year. What 66% of a median gives an hour is our arithmetic, except where Tynwald or the Minimum Wage Committee printed it.
- Limits: every figure is a sample estimate, and the reports publish margins of error only for some. The median covers full-time employees only; part-time and zero-hours workers are reported separately. Sector figures are averages from small samples. The UK comparison sets April against June. The Living Wage was recalibrated in 2025 and the gender pay gap method revised in 2024, so neither compares across those breaks. Nothing here estimates pay after June 2025.
Download every June, 2012 to 2025, as CSV. Free to reuse under CC BY 4.0: please credit "Paygrade analysis of Statistics Isle of Man data" and link to this page. Journalists: email hello@paygradecareers.com for any cut of the figures.
Sources
- Statistics Isle of Man, Cabinet Office, Isle of Man Earnings Survey Report 2025 (published June 2026): Tables 1, 2, 3, 6, 10, 11, 12, 13 and 16; and the Earnings Survey Report 2023 (May 2024): Tables 3, 8, 10 and 11.
- Statistics Isle of Man, Isle of Man Historic Data Sets, December 2025: the Consumer Price Index, January 2008 = 100.
- Economic Affairs, Isle of Man Earnings Survey Report 2019, reproduced in Tynwald paper PP 2021/0105 (Appendix 28), and the full-time earnings percentiles 2003 to 2017 in PP 2019/0122, Volume 2.
- Tynwald written answers W-202501-1645 (public and private sector medians, 2020 to 2024) and W-202601-2069 (minimum wage decisions, 2014 to 2026).
- Tynwald, Votes and Proceedings, 14 July 2025 (PP 2025/0107); Department for Enterprise, minimum wage review (GD 2025/0048); Minimum Wage Committee, letters of 2 September 2025 (GD 2025/0089) and 19 January 2026 (GD 2026/0006); Council of Ministers, Annual Report on Poverty Measures 2026 (GD 2026/0021).
- Tynwald Select Committee on Poverty, oral evidence of 28 February 2025.
Related
- Is Jersey pay keeping up with prices? and Guernsey: the same question, from each island's own statistics
- Is Gibraltar pay keeping up with prices?
- More Paygrade studies